Finding the maximum value of a function is an important task in statistics. There are three approaches to finding a maxima:
- When the function is available as an analytic expression, you can use an optimization algorithm to find the maxima. For example, in the SAS/IML language, you can use any of several nonlinear programming (NLP) functions, such as the NLPNRA function, which uses a Newton-Raphson algorithm.
- When the function is observed only at a discrete set of points and in the presence of noise, you can use various regression techniques (both parametric and nonparametric) to fit a smooth curve through the data, and then find the maxima of the predicted smoother.
- When you don't want a complicated model of the data, you can find the local maxima of the piecewise linear function that connects the data points. For example, in the time series shown below, you might want to find the values that are circled. These are values for which the piecewise linear function has a local maximum.

The third technique is the topic of this post. This post is motivated by two postings that I saw on Stack Overflow. One was a general question about finding a local maximum in a time series. The other was an application. The question concerned finding the locations at which the density of univariate data exhibits a peak. I was intrigued by the posted answers because they used an innovative sequence of function calls to the DIF and SIGN function. This article describes the technique and shows how to perform the computations in the SAS/IML language.
I don't claim that this is the best way to find local maxima of a time series, but I think it is interesting.
Find maxima in the interior
In the SAS/IML language you can use the DIF function to compute finite differences. Finite differences approximate the derivative of a function. (For a piecewise linear (PL) function, they are exactly the slopes of the PL segments.) A point in the interior of an interval is a maximum when a line segment with positive slope is followed by a line segment of negative slope. Examples are shown by the red circles in the previous graph. You can use the SIGN function (or signum function) to produce a vector of signs (+1, 0, or –1) for a set of negative, positive, or zero slopes. The following statements compute the signs of the slopes and the difference between successive signs:
proc iml;
y = {2.3, 2,2.5,2.7,2.4,2,1.7,4,3.9,4,3.5,3.3,4};
x = T(1:nrow(y));
/* for this example, we know which points are maxima */
peak={1,0,0,1,0,0,0,1,0,1,0,0,1};

/* Find peaks in the interior */
slope = dif(y);
sgn = sign(slope);
difSgn = dif(sgn);
print x y slope sgn peak difSgn; |
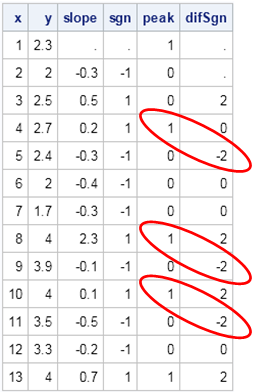
The table shows the slope and the sign of the slope for the example time series. Notice for this example that local maxima in the interior are always followed by a –2 in the difSgn column. Therefore if you want to locate the indices of the maxima, you can find the indices for which difSgn = –2 and then subtract 1 from the indices. I thought that this was a very cool result when I saw it on Stack Overflow, where it was presented as the following "one-liner":
idx = loc(dif(sign(dif(y)))=-2) - 1; /* find maxima of a time series */ |
A caveat and an extension for repeated maxima
Unfortunately, this DIF-SIGN-DIF sequence is not robust to the presence of repeated maxima. The example data does not contain any repeated maxima, but you can alter the example and convince yourself that the –2 values become –1 or 0 when the time series contains a repeated maximum.
In many applications (for example, daily closing stock prices), repeated maxima are somewhat rare. Accordingly, this simple method might be sufficient for your application. The following statement finds the locations of such maxima and extends the Stack Overflow solution by handling up to two repeated maxima. The statement calls the ELEMENT function to indicate when the difSgn vector is either –1 or –2./* difSgn[i] is sign of segment i-1, so subtract 1 from result */
idx = loc(element(difSgn, {-1 -2})) - 1; |
Find all maxima
Up to now, we've considered maxima on the interior of the time series domain. As you might remember from your calculus class, the maxima of a function can also occur at the endpoints of a closed interval. You can use IF-THEN statements to check the endpoints. Alternatively, you can add two new points to the time series, so that the original points are now interior points. That is the approach taken by the following function, which encapsulates a version of the algorithm that works for data without repeated maxima:
/* Return the location of the local maxima of a vector (including end points).
If there are duplicate values at a maximum, the index
of the first and last maximum value is returned. */
start locpeaks(x);
small = min(x)-1; /* smaller than any point in the series */
y = small // colvec(x) // small;/* original values are now in the interior */
difSgn = dif(sign(dif(y))); /* dif of sign of slopes */
/* subtract 2: -1 for inserting 'small' at the beginning, and -1
for the fact that negative values occurs AFTER the maximum */
return(loc(element(difSgn, {-1 -2})) - 2);
finish;
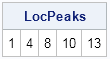
LocPeaks = locpeaks(y);
print LocPeaks; |
I'm not 100% happy with this function because it doesn't handle multiple consecutive maxima. If you give it a vector of constant values such as {1, 1, 1}, it incorrectly reports that the first and third values are maxima, but not the second.
Nevertheless, I like the elegance of the DIF-SIGN-DIF sequence, so I wanted to share this trick. You can devise more complicated algorithms to handle the degenerate cases, but this function works for most time series that arise in practice.

1 Comment
Pingback: How to tell whether a sequence of heads and tails is random - The DO Loop