Tag: SAS Programming

Rick Wicklin 0
Creating a periodic smoother

In yesterday's post, I discussed a "quick and dirty" method to smooth periodic data. However, after I smoothed the data I remarked that the smoother itself was not exactly periodic. At the end points of the periodic interval, the smoother did not have equal slopes and the method does not

Rick Wicklin 0
Smoothers for periodic data

Over at the SAS and R blog, Ken Kleinman discussed using polar coordinates to plot time series data for multiple years. The time series plot was reproduced in SAS by my colleague Robert Allison. The idea of plotting periodic data on a circle is not new. In fact it goes

Rick Wicklin 0
Count missing values in observations

Locating missing values is important in statistical data analysis. I've previously written about how to count the number of missing values for each variable in a data set. In Base SAS, I showed how to use the MEANS or FREQ procedures to count missing values. In the SAS/IML language, I

Rick Wicklin 0
How to access SAS sample programs

Have you ever wanted to run a sample program from the SAS documentation or wanted to use a data set that appears in the SAS documentation? You can: all programs and data sets in the documentation are distributed with SAS, you just have to know where to look! Sample data

Rick Wicklin 0
Random number seeds: Only the first seed matters!

The other day I encountered the following SAS DATA step for generating three normally distributed variables. Study it, and see if you can discover what is unnecessary (and misleading!) about this program: data points; drop i; do i=1 to 10; x=rannor(34343); y=rannor(12345); z=rannor(54321); output; end; run; The program creates the

Rick Wicklin 0
Constants in SAS

Statistical programmers often need mathematical constants such as π (3.14159...) and e (2.71828...). Programmers of numerical algorithms often need to know machine-specific constants such as the machine precision constant (2.22E-16 on my Windows PC) or the largest representable double-precision value (1.798E308 on my Windows PC). Some computer languages build these

Rick Wicklin 0
A SAS Christmas tree

A few colleagues and I were exchanging short snippets of SAS code that create Christmas trees and other holiday items by using the SAS DATA step to arrange ASCII characters. For example, the following DATA step (contributed by Udo Sglavo) creates a Christmas tree with ornaments and lights: data _null_;

Programming Tips
Rick Wicklin 0
Loops in SAS

Looping is essential to statistical programming. Whether you need to iterate over parameters in an algorithm or indices in an array, a loop is often one of the first programming constructs that a beginning programmer learns. Today is the first anniversary of this blog, which is named The DO Loop,

Rick Wicklin 0
Visualizing correlations between variables in SAS

Exploring correlation between variables is an important part of exploratory data analysis. Before you start to model data, it is a good idea to visualize how variables related to one another. Zach Mayer, on his Modern Toolmaking blog, posted code that shows how to display and visualize correlations in R.

Rick Wicklin 0
Simulate categorical data in SAS

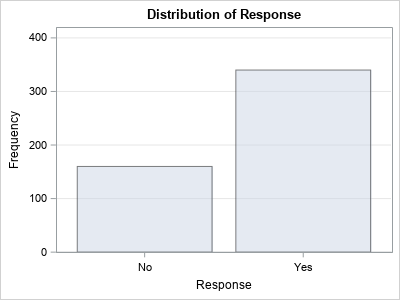
As I was reviewing notes for my course "Data Simulation for Evaluating Statistical Methods in SAS," I realized that I haven't blogged about simulating categorical data in SAS. This article corrects that oversight. An Easy Way and a Harder Way SAS software makes it easy to sample from discrete "named"

1 10 11 12 13 14