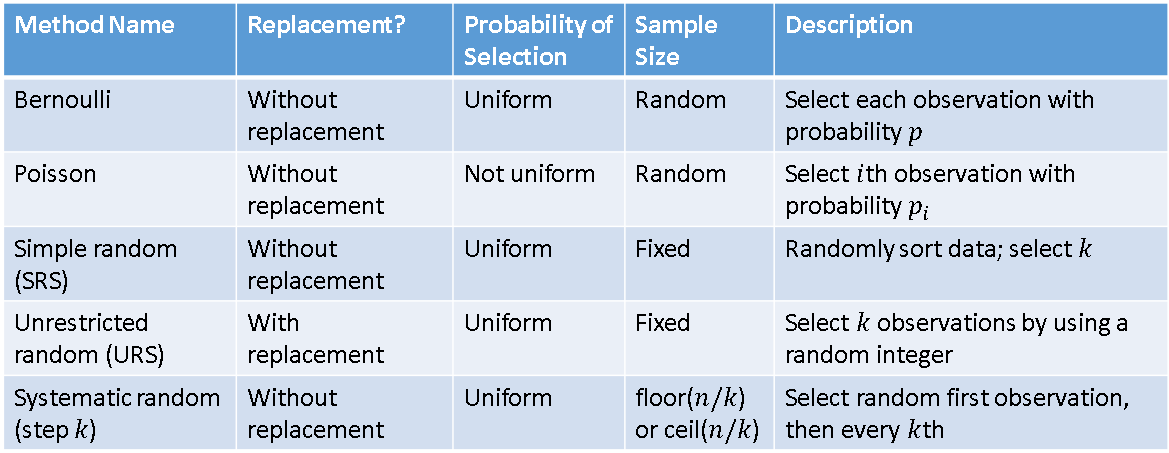
Tag: SAS Programming

Rick Wicklin 0
Add a diagonal line to a scatter plot

In my statistical analysis of coupons article, I presented a scatter plot that includes the identity line, y=x. This post describes how to write a general program that uses the SGPLOT procedure in SAS 9.2. By a "general program," I mean that the program produces the result based on the

Rick Wicklin 0
The COALESCE function: PROC SQL compared with PROC IML

When Charlie H. posted an interesting article titled "Top 10 most powerful functions for PROC SQL," there was one item on his list that was unfamiliar: the COALESCE function. (Edit: Charlie's blog no longer exists. The article used to be available at http://www.sasanalysis.com/2011/01/top-10-most-powerful-functions-for-proc.html) Ever since I posted my first response,

Advanced Analytics
Rick Wicklin 0
When sharks attack!

The Junk Chart blog discusses problems with a chart which (poorly) presents statistics on the prevalence of shark attacks by different species. Here is the same data presented by overlaying two bar charts by using the SGPLOT procedure. I think this approach works well because the number of deaths is

Programming Tips
Chris Hemedinger 0
World Statistics, FTW!

Yesterday, I was in the #raganSAS audience as David Pogue told me What's New and What's Next in the world of technology. David is a great presenter, and he really had the audience engaged as he talked about augmented reality, his world according to Twitter, and an iPhone app that

1 11 12 13 14