You can modify all of the components of the graphs that analytical procedures produce: the data object, graph template, and the dynamic variables. This post takes a closer look at dynamic variables (which you can see by using PROC DOCUMENT) and data objects and explores graphs that are constructed from more than one data object.
Tag: PROC DOCUMENT
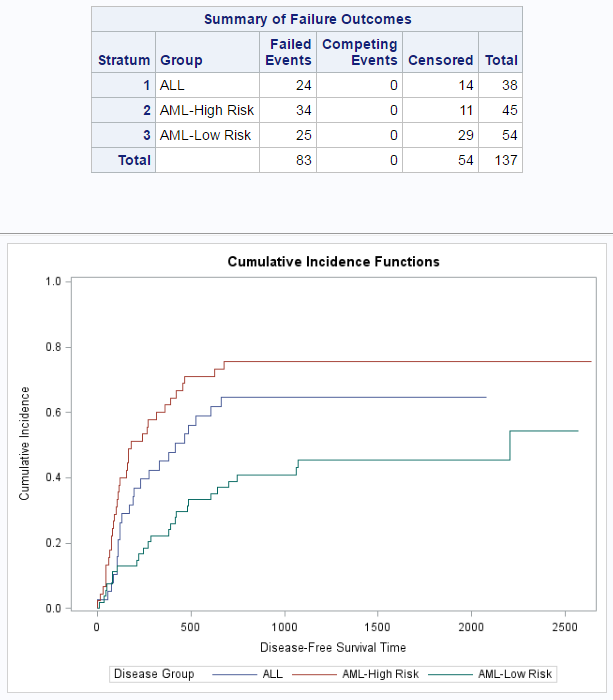
In my previous post, I showed you how to change the titles in graphs produced by analytical procedures; today I will show you how to remove subtitles that procedures display on some output pages. The following step creates output that contains a SAS title ('Illustrate the CIF Plot'), a PROCTITLE
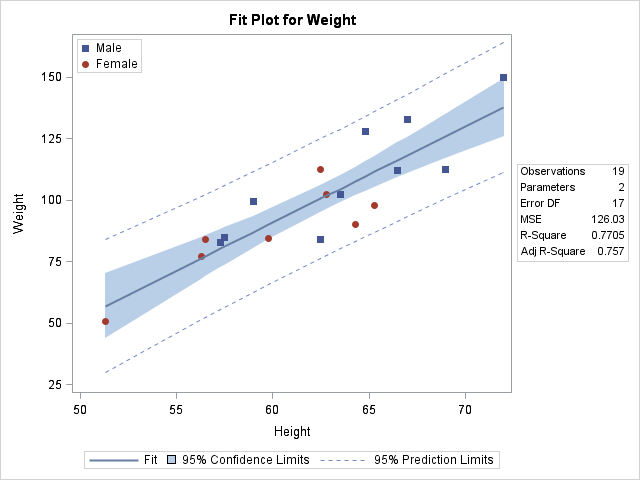
A customer wants to use PROC REG to fit a simple regression model but display in the fit plot markers that differentiate groups of individuals. Click on a graph to enlarge. Before we see how to do that, let's look at some simpler examples. The following step fits a linear
I have written a new book on advanced ODS Graphics examples. It is available as a free PDF file on the web. It is in color, and all of the SAS code is available by double clicking a link at the beginning of each example. Advanced ODS Graphics Examples Update:
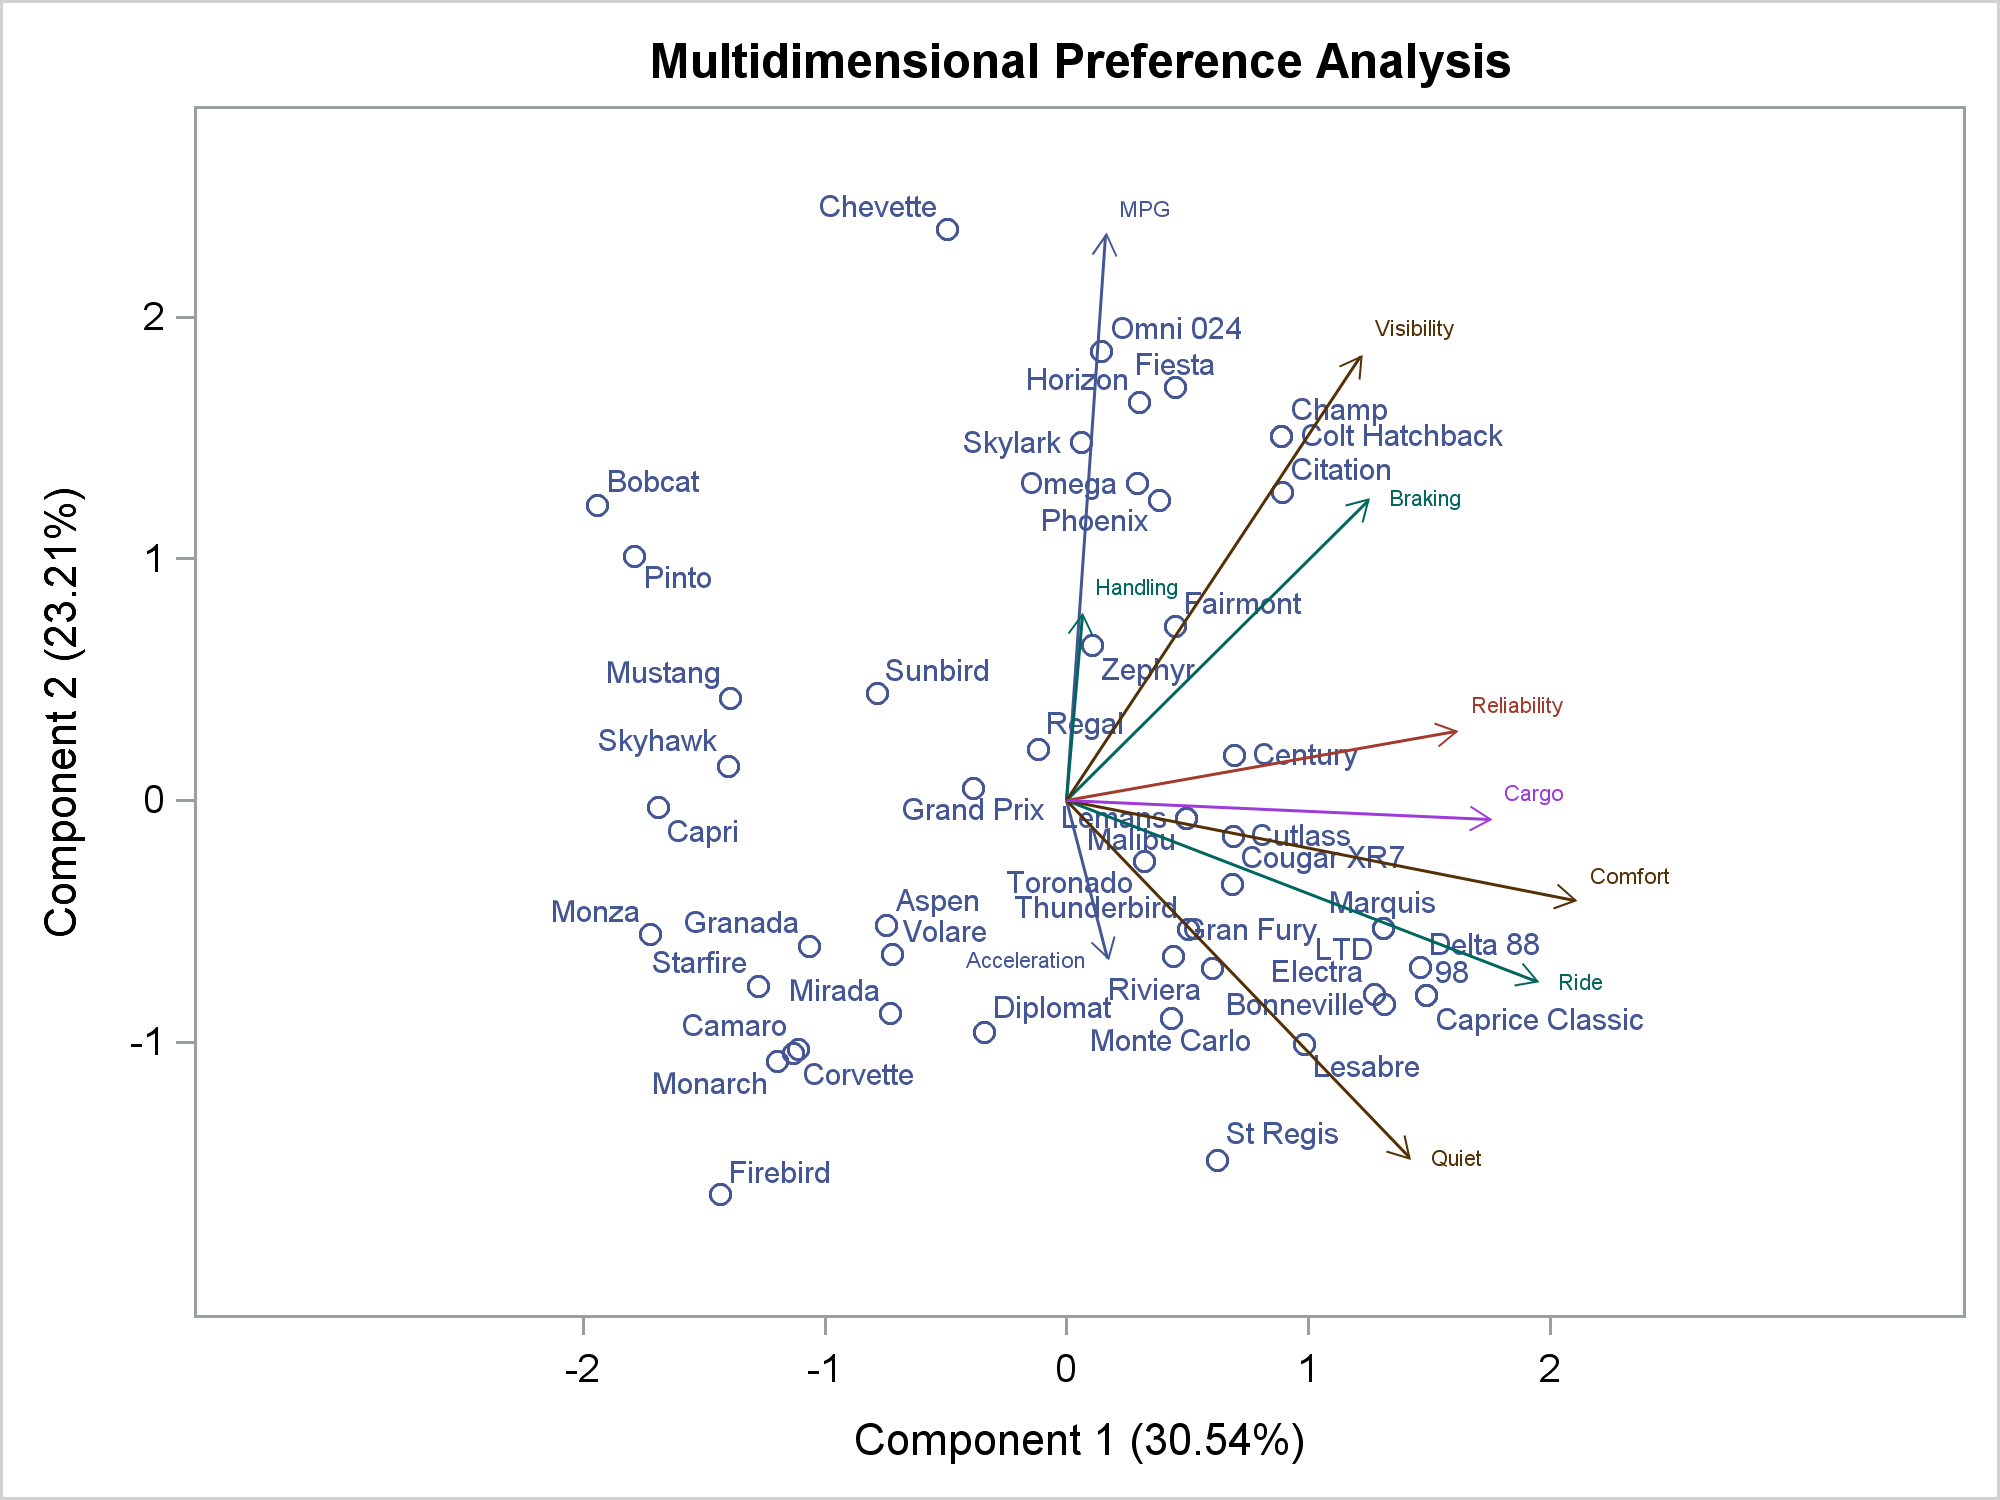
In the past few weeks, I have written two posts on SG annotation and on saving and then modifying the graphs that analytical procedures produce: Modifying dynamic variables in ODS Graphics Annotating graphs from analytical PROCs Today, I finish this series with one more post. This one shows how you
There are many ways to modify the graphs that SAS creates. Standard graph customization methods include template modification (which most people use to modify graphs that analytical procedures produce) and SG annotation (which most people use to modify graphs that procedures such as PROC SGPLOT produce). However, you can also
If you are familiar with the output delivery system (ODS), then you know that you can modify the tables and graphs that analytical procedures display by modifying table and graph templates. Perhaps less familiar is the fact that you can also modify dynamic variables. Tables and graphs are constructed from
Hot off the press and debuting at NESUG is Michael Tuchman's new book, PROC DOCUMENT by Example Using SAS. Tuchman's book demonstrates the practical uses of the DOCUMENT procedure, a part of the Output Delivery System, in SAS 9.3. The DOCUMENT procedure allows general SAS users to store and manage