Real-time data empowers governments and agencies to monitor vehicle and vessel movements, ensuring operators comply with regulations and embrace sustainable fishing practices. It also helps identify those willing to cross ethical boundaries to boost their catch and profits.
As part of this year's IEEE Visual Analytics Science and Technology (VAST) Challenge, a group of SAS data scientists decided to tackle such problems and use SAS Viya and related machine learning tools to the ultimate test — to identify individuals in a complex fishing network. Excitedly, the team received the Honorable Mention Award for Breadth of Investigation!
If you are interested in reading about our last submission, you can find all the details in this related blog post.
The process
We used SAS® Viya tools to import, adjust, and format the data. Our resources included news articles, a large network graph, vessel movements, and geographical data on ecological preserves and fishing grounds. The knowledge graph features over 5,000 nodes and more than 250,000 edges. We explored operator and vessel characteristics, along with travel and movement patterns, using SAS® Visual Analytics. SAS Viya's machine learning (ML) and network analytics capabilities helped us analyze temporal and structural patterns to identify potential illegal fishing activities. We included the operator SouthSeafood Express, known for illegal fishing practices, to support this analysis.
The tools
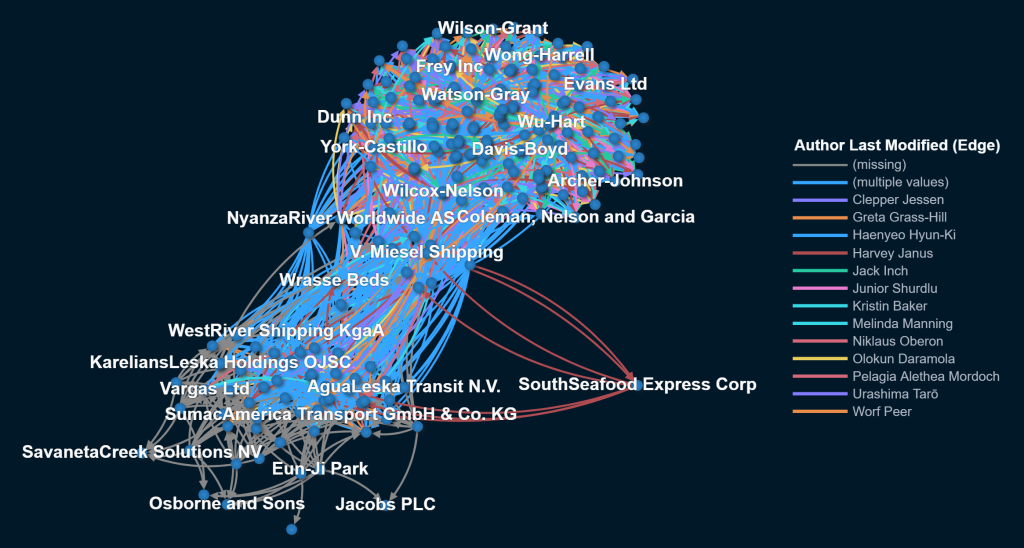
We conducted most of the work using SAS Studio and SAS Visual Analytics. To prepare and adjust the data, we utilized SAS data steps for efficient analysis. JSON files were stored in SAS Viya, and we aggregated certain datasets for easier processing. Business rules and mappings enhanced visual discovery in SAS Visual Analytics. For specific use cases, additional tables were created, such as merging port-exit cargo data with vessel harbor visits and movement data to represent ship off-loads at a harbor. Specialized transactional structured data tracked all travel paths a vessel took between harbor visits.
The solution - Challenge 1
The first challenge in this contest targets bias analysis in news articles, algorithms, and analysts. We analyzed several articles to identify potential bias and changes over time. Sentiment analysis revealed that most sources were predominantly positive. The Haacklee Herald had the highest percentage of negative articles at 6.4%. Entities like Murray, Friedman, Wall, and Wilcox-Nelson were reported negatively in the Haacklee Herald but positively in sources like Lomark Daily and The News Buoy. This disparity suggests that some newspapers may show bias toward certain entities. Articles often used loaded terms, mostly positive, indicating a positive bias.

Analysis of events in the knowledge graph showed similar trends. Entities like NyanzaRiver Worldwide AS and V. Miesel Shipping shifted from negative to positive sentiment over time in The News Buoy. SouthSeafood Express, though missing from some article filenames, was linked to only positive events. This positive sentiment pattern appeared across various sentiment analysis algorithms. Most events were neutral or positive, with negative events mostly from police reports.
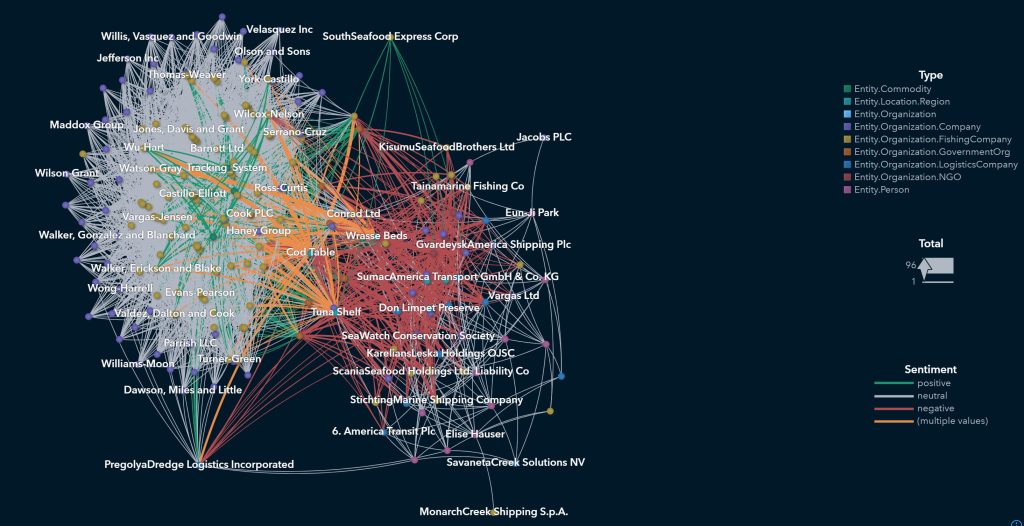
The analysis indicates a general positive bias in the knowledge graph. Results were similar across algorithms, showing no significant bias towards any specific method. Concerns arose about Harvey Janus, who spent an unusually large amount of time editing SouthSeafood Express. His edits were consistently favorable despite the entity's illegal fishing practices, suggesting potential intentional bias.
This discrepancy between the knowledge graph and articles suggests possible data manipulation by Harvey, warranting further investigation and audits of his editing activities.
The solution - Challenge 2
Challenge 2 focuses on analyzing ship movements and shipping records to understand illegal fishing practices. The analysis of commercially caught fish through Oceanus reveals important trends and anomalies in cargo exports and vessel activities.

The analysis of cargo exports through Oceanus reveals distinct patterns in fish distribution, with some fish species, like Tuna, are exported during narrow time frames, such as late October. Harbors display varied activity levels, with some like Himark busy year-round, while others such as Lomark show increased activity in the latter half of the year. Notably, some data include negative values, requiring further investigation to understand their significance.

Using vessel travel details, the team identifies potential matches for commodity deliveries. By analyzing available fish species and vessel locations before harbor arrival, they narrow down potential vessel matches. Visualization tools show that match confidence is higher in the first half of the year compared to the second, where multiple potential matches complicate vessel identification.
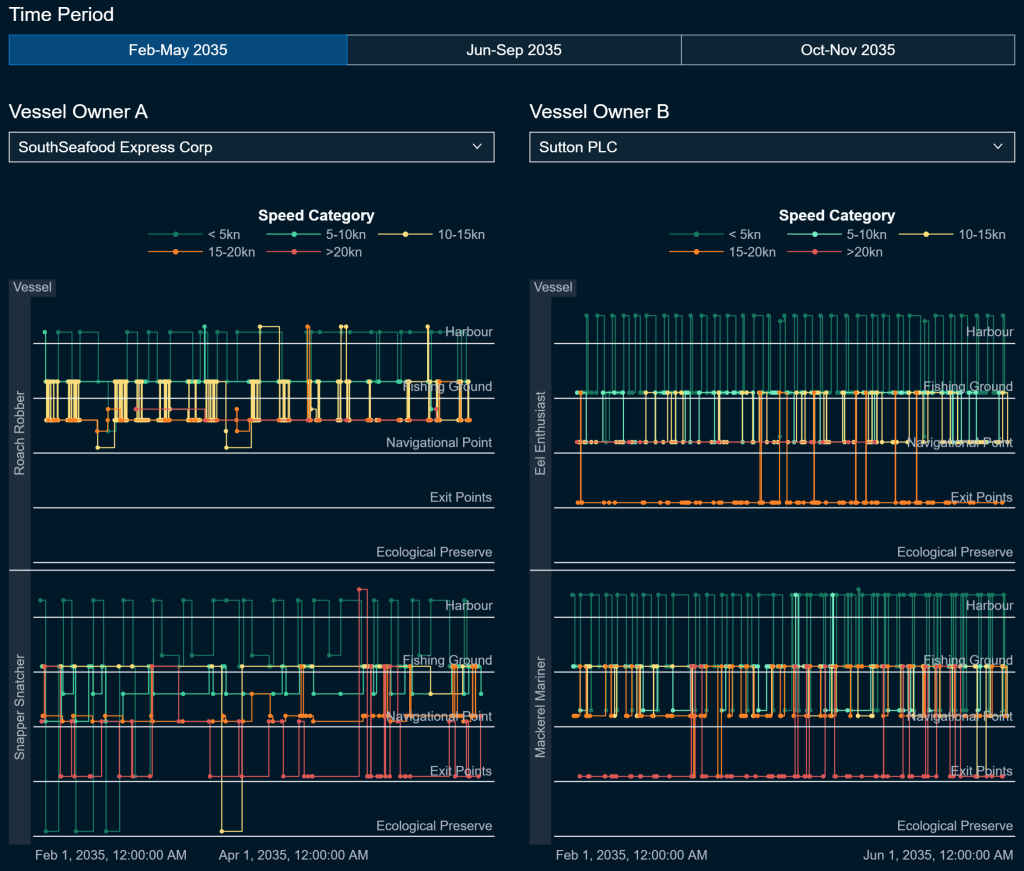
Further analysis of SouthSeafood Express Corp's vessels indicates potential illegal fishing activities. The Snapper Snatcher, in particular, exhibited suspicious behavior by spending extended periods in ecological preserves.

Blackout periods in transponder signals and discrepancies in arrival times suggest covert operations. Post-May 2035, no data from SouthSeafood vessels is recorded, and new companies emerge, hinting at potential shifts in fishing activities.
The results
We provided our findings in video format highlighting some of the approaches taken when analyzing the VAST challenge data:
- Challenge 1
- Challenge 2
We also utilized the SAS Visual Analytics SDK to provide interactive access to all visualization in the submission. You can view all visualizations in the submission by exploring the related forms for Challenge 1 or Challenge 2.
The VAST Challenge offers an excellent opportunity to test our software against real-world scenarios with complex data sets. Through these projects, we gain valuable insights and provide feedback to our development teams, helping to enhance product capabilities for our customers.
The team
Participating in VAST challenges is always exciting, but it demands a dedicated team with a strong grasp of various technologies. This effort was spearheaded by Falko Schulz, with significant contributions from Stu Sztukowski, Amy Becker, and Steven Harenberg. A special thanks to Shaun Kurian, Chelsea Mayse and Rachel McLawhon for their commitment and meticulous work in creating outstanding video summaries. This achievement wouldn't have been possible without each of you.
Thank you once again to the entire SAS team!
References
- VAST Challenge 2024
- Visual Analytics Benchmark Repository
- Challenge 1: YouTube Submission Video - Submission Form
- Challenge 2: YouTube Submission Video - Submission Form
- SAS Institute Inc. SAS Visual Analytics. (Online.) 2024.