Needle sharing remains a critical public health challenge because it enables the rapid spread of infectious diseases through close, often invisible social connections. Understanding where these behaviors concentrate and which individuals play a central role is essential for designing effective, targeted interventions. Limited time and resources make this especially true.
This post uses the SAS Viya NETWORK action set to demonstrate how a sequence of network analytics, including summary statistics, centrality measures, and community detection, can make these hidden patterns visible by revealing who is most connected, where risk might originate, and how it can flow through a community. Together, these insights support more focused and effective public health interventions.
The data set used in this analysis was provided with permission from Margaret R. Weeks at the Institute of Community Research. This data set originates from the study described in the paper “Social Networks of Drug Users in High-Risk Sites: Finding the Connections”. The data consist of a simple directed link list, where each link represents the lending of drug needles from one individual to another, reflecting observed needle-sharing interactions within the network.
The SAS code used throughout this analysis is accessible here for reference and reuse.
From Raw Data to Network Insight
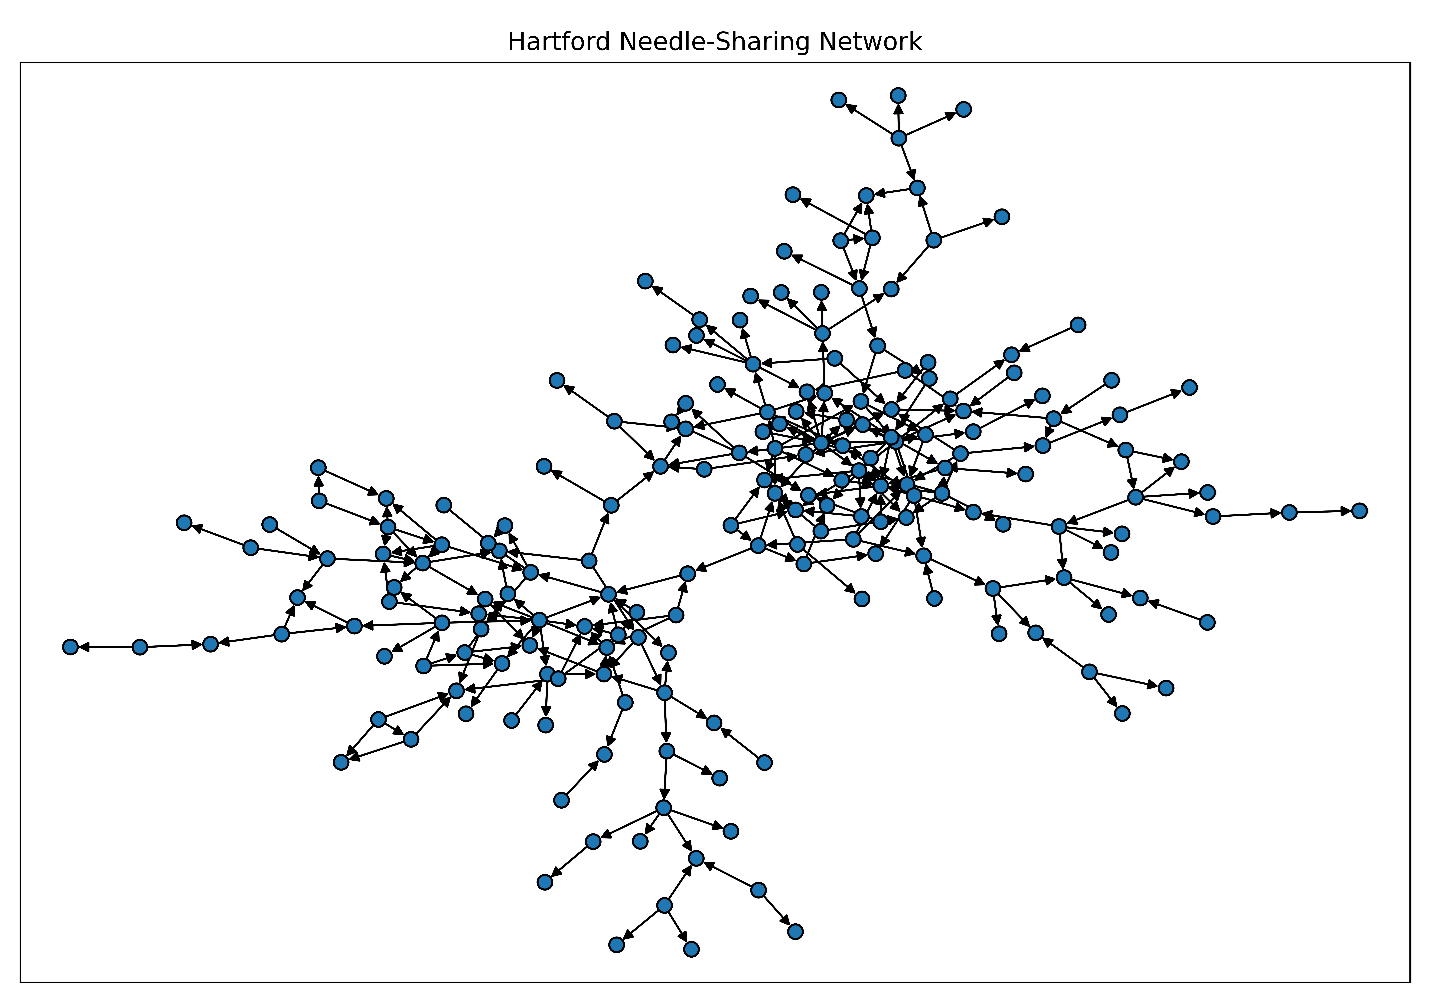
As shown in this code snippet, we begin by running the %PlotGraph macro to visualize the network and gain an immediate sense of its connectivity, revealing clusters of closely connected individuals and several highly connected participants that anchor interactions across the network.
%PlotGraph( links=mycas.DrugNetwork, direction="directed", nodescolor="tab:blue", nodesshape="o", nodessize=50, displaylabels=no, title="Hartford Drug User Needle-Sharing Network"); |
We next load the input data into an optimized in-memory graph object by using the loadGraph action from the NETWORK action set. This step enables the subsequent action calls to proceed without repeatedly rebuilding the graph from the raw data. Although the network in this post is relatively small, this approach reflects best practices for using SAS Viya Network analytics in real-world settings, where graphs are larger, analyses are iterative, and performance and scalability matter.
proc cas; loadactionset "network"; action network.loadGraph result=r status=s / links = "DrugNetwork" direction = "directed" outGraphList = "OutGraphList"; run; action table.fetch / table = "OutGraphList"; run; quit; |
Table 1 shows an in‑memory directed graph (graph ID 0) with 193 nodes and 273 links.

Exploring the Network Structure
To move from visual intuition to more concrete insight, we next run the summary action from the NETWORK action set to quantify key structural properties of the graph. Here, we show the corresponding code.
proc cas; action network.summary result=r status=s / graph = 0 outNodes = "NodesOutSummary" out = "Summary" connectedComponents = true; run; action table.fetch / table = "NodesOutSummary"; run; action table.fetch / table = "Summary"; run; quit; |
As shown in Table 2, the network consists of 193 nodes connected by 273 directed links. This results in a low overall density, which is typical of social networks formed through selective interactions. The results also reveal 80 leaf nodes and no isolated pairs or isolated star structures. This reinforces that all nodes participate in the broader network of interactions.
The results also indicate that the network contains 193 connected components, confirming that each node forms its own strongly connected component. This means the network contains no directed cycles and can be treated as a directed acyclic graph (DAG), a property that helps clarify how interactions flow through the network.

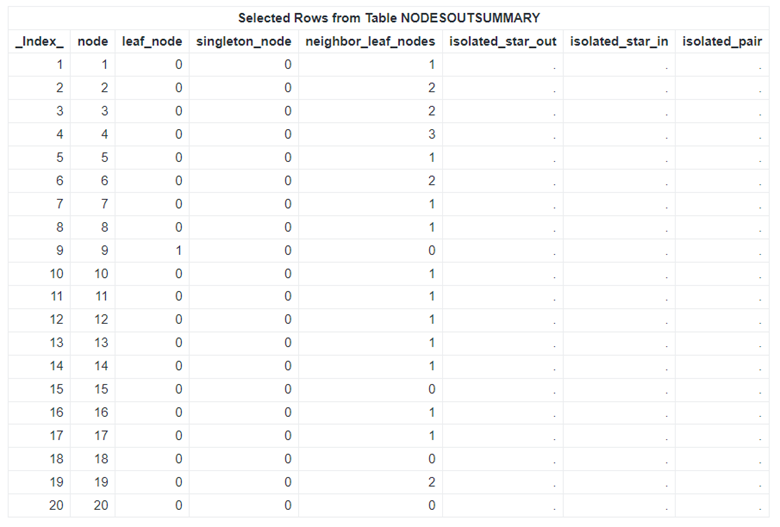
Table 3 presents selected rows from the NodesOutSummary table, which contains node-level summary metrics for the graph. Building on these results, we further explore the network’s structure by focusing on leaf nodes, defined as nodes with an outdegree of 0. Although these nodes might not appear influential based on centrality measures, they mark important boundaries where interactions terminate within the network.
Highlighting Leaf Nodes in the Network
In this step, we use the NodesOutSummary table to highlight leaf nodes within the network visualization. This brings attention to individuals who sit at the outer boundaries of interaction. Here is the code used to generate this visualization:
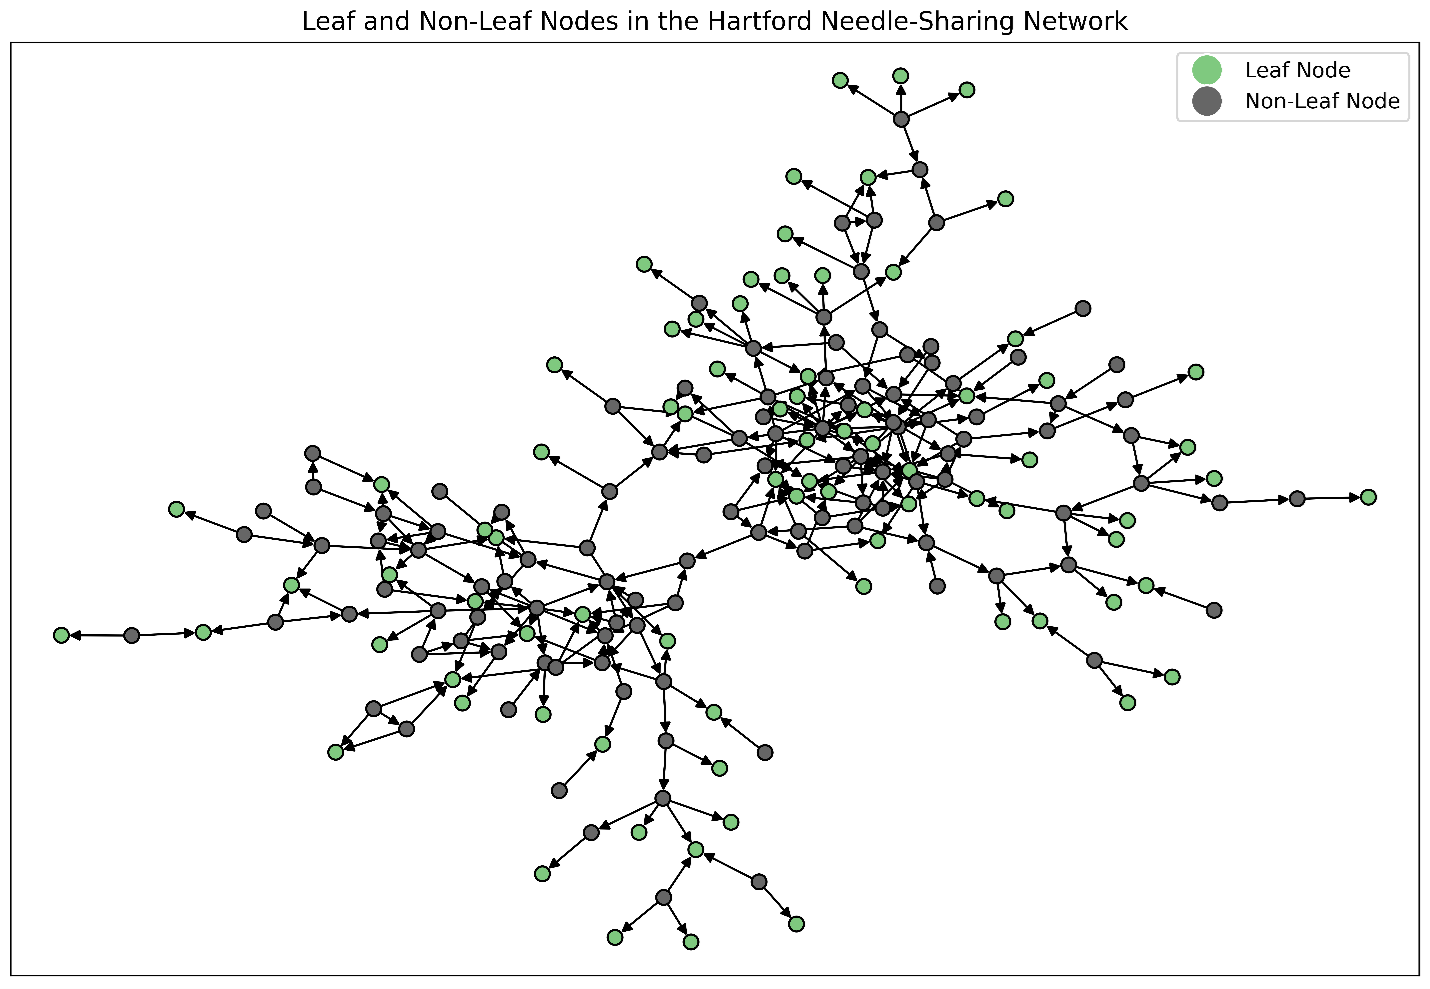
data mycas.NodesOutSummary; set mycas.NodesOutSummary; length role $20; if leaf_node = 1 then role = "Leaf Node"; else role = "Non-Leaf Node"; run; %PlotGraph( links=mycas.DrugNetwork, nodes=mycas.NodesOutSummary, direction="directed", nodescolorbycategory="role", nodescolorlegend=yes, nodesshape="o", nodessize=50, displaylabels=no, title="Leaf and Non-Leaf Nodes in the Hartford Drug User Needle-Sharing Network"); |
The resulting network with highlighted leaf nodes is shown in Figure 2. In the context of needle sharing, these leaf nodes represent individuals who receive needles but do not pass them on to others. This makes them endpoints in observed sharing chains. Such nodes might correspond to new participants, individuals with limited social connections, or users whose risky behaviors do not propagate further through the network.
Recognizing leaf nodes helps surface populations that might be particularly vulnerable to exposure. It also highlights opportunities for targeted intervention strategies focused on prevention, monitoring, or supporting disengagement from risky behaviors.
Identifying Influential Nodes
After gaining an initial understanding of the network structure, the next step is to understand which individuals play a more prominent role in the pattern of interactions. In network analysis, one of the most straightforward and interpretable measures for this purpose is degree centrality. This reflects the number of direct connections an individual has to others in the network.
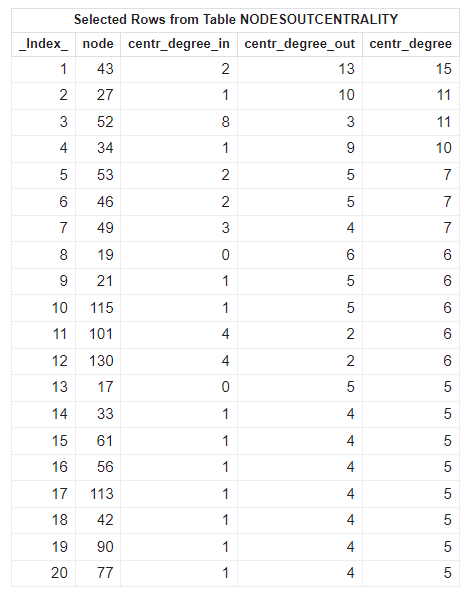
As shown in the code, we use the centrality action from the SAS Viya NETWORK action set to compute unweighted degree centrality for each individual. In a needle-sharing network, nodes with high degree centrality indicate individuals who share needles with many others. This makes them key points for disease transmission and priority targets for intervention or monitoring.
proc cas; action network.centrality result=r status=s / graph = 0 degree = "unweight" outNodes = "NodesOutCentrality"; run; action table.fetch table = "NodesOutCentrality" sortBy = {{name = "centr_degree" order="descending"} {name = "centr_degree_out" order="descending"}}; run; quit; |
In the previous step, we visualized the network by highlighting leaf nodes. That is, individuals with zero out-degrees, acting as endpoints in observed needle-sharing chains. This view helps identify peripheral and potentially vulnerable participants. However, it does not fully capture how risk might propagate through the network.
With the centrality results now available, we can extend this analysis by distinguishing among three node roles based on their in-degree and out-degree patterns:
- Source nodes, which lend needles but do not receive them.
- Bridge nodes, which both receive and lend needles and therefore act as transmitters within the network.
- Leaf nodes, which receive needles but do not lend them onward.
We replot the network and use this richer classification to better reflect the functional roles individuals play in needle-sharing interactions. Here is the code snippet for this step:
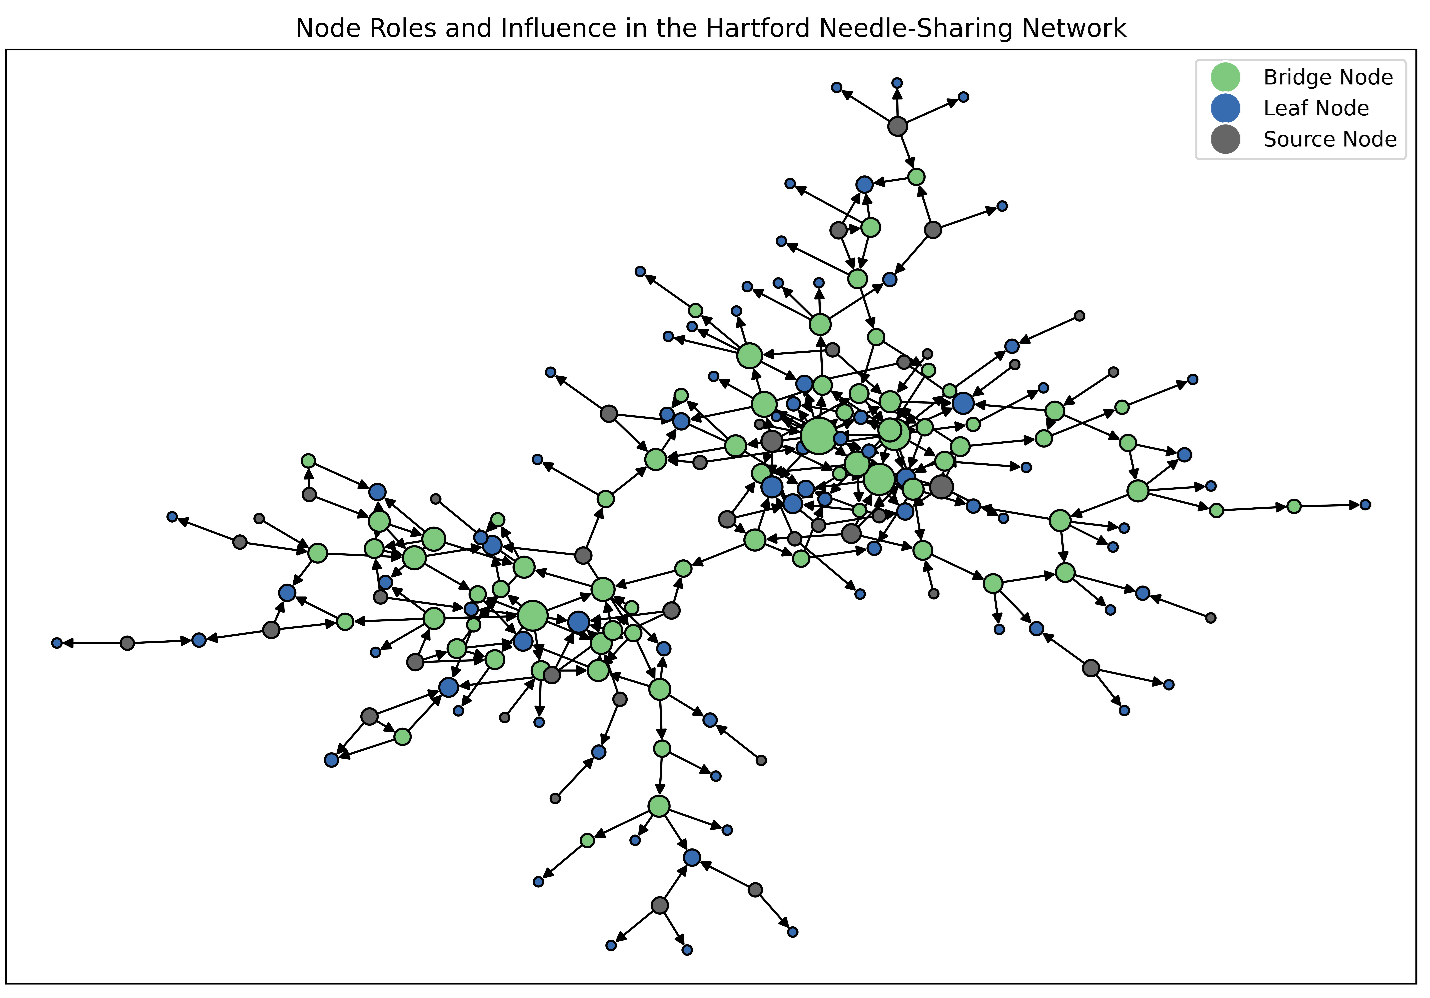
data mycas.NodesOutCentrality; set mycas.NodesOutCentrality; length role $20; centr_degree_scaled = centr_degree * 20; /* Scale for better visualization */ if centr_degree_out = 0 and centr_degree_in = 0 then role = "Isolated Node"; else if centr_degree_out > 0 and centr_degree_in = 0 then role = "Source Node"; else if centr_degree_out = 0 and centr_degree_in > 0 then role = "Leaf Node"; else role = "Bridge Node"; run; %PlotGraph( links=mycas.DrugNetwork, nodes=mycas.NodesOutCentrality, direction="directed", nodescolorbycategory="role", nodescolorlegend=yes, nodesshape="o", nodessize="centr_degree_scaled", displaylabels=no, title="Node Roles and Influence in the Hartford Drug User Needle-Sharing Network"); |
In Figure 3, node color indicates the node role (source, bridge, or leaf). Node size is proportional to overall degree (in-degree plus out-degree), highlighting individuals with higher levels of interaction.
This combined view provides a more nuanced understanding of the network by simultaneously revealing who initiates risk, who propagates it, and where it terminates. Such insights are critical for designing intervention strategies that differentiate between prevention, containment, and harm-reduction efforts across different segments of the network.
Detecting Communities in the Network
Beyond identifying influential individual nodes, it is often important to understand how the network organizes itself into groups of closely connected nodes. These nodes are commonly referred to as communities. Communities can reveal underlying structure in the network. An example would be subgroups where interactions are more frequent within the group than with the rest of the network.
In the following cell, we use the community action from the NETWORK action set to detect communities within the graph. This action partitions the network into cohesive subgraphs based on connectivity patterns. This enables us to identify clusters of nodes that might represent tightly connected groups.
Community detection is especially valuable in this setting because it highlights localized patterns of interaction. It can also inform targeted analysis or intervention strategies that focus on groups rather than on isolated individuals.
As shown in this code, we apply the Louvain method for community detection. We assess how different resolution values affect the granularity of the resulting communities. Lower-resolution values tend to identify fewer, larger communities, whereas higher-resolution values yield more, smaller, more fragmented groups.
proc cas; action network.community result=r status=s / graph = 0 resolutionList = 0.3 outNodes = "NodesOutCommunity"; run; action table.fetch / table = "NodesOutCommunity"; run; quit; |
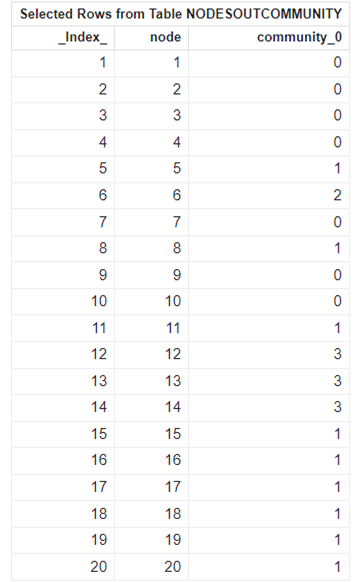
At the selected resolution of 0.3, the network is partitioned into five distinct communities. The resulting community assignments are added to the outNodes table, as shown in Table 5.
Final Visualization: Communities, Roles, and Node Influence
With insights from both the centrality and community analyses in place, we bring these perspectives together to support a unified, more informative visualization. By using the FedSQL action set, node-level results from the degree centrality analysis, along with community assignments, are combined to produce a single table that captures node influence, community membership, and functional role. This integrated view enables multiple dimensions of the network to be examined simultaneously.
proc cas; action fedsql.execDirect result=r status=s / query = ' create table mycas.NodesOutEnriched as select a.*, b.community_0, case when a.role = ''Leaf Node'' then ''square'' when a.role = ''Source Node'' then ''triangle'' when a.role = ''Bridge Node'' then ''circle'' else ''triangle'' /* isolated nodes */ end as "shape" from mycas.NodesOutCentrality as a left join mycas.NodesOutCommunity as b on a.node = b.node '; quit; |
The enriched data then generates the final network visualization. The corresponding code snippet is provided here:
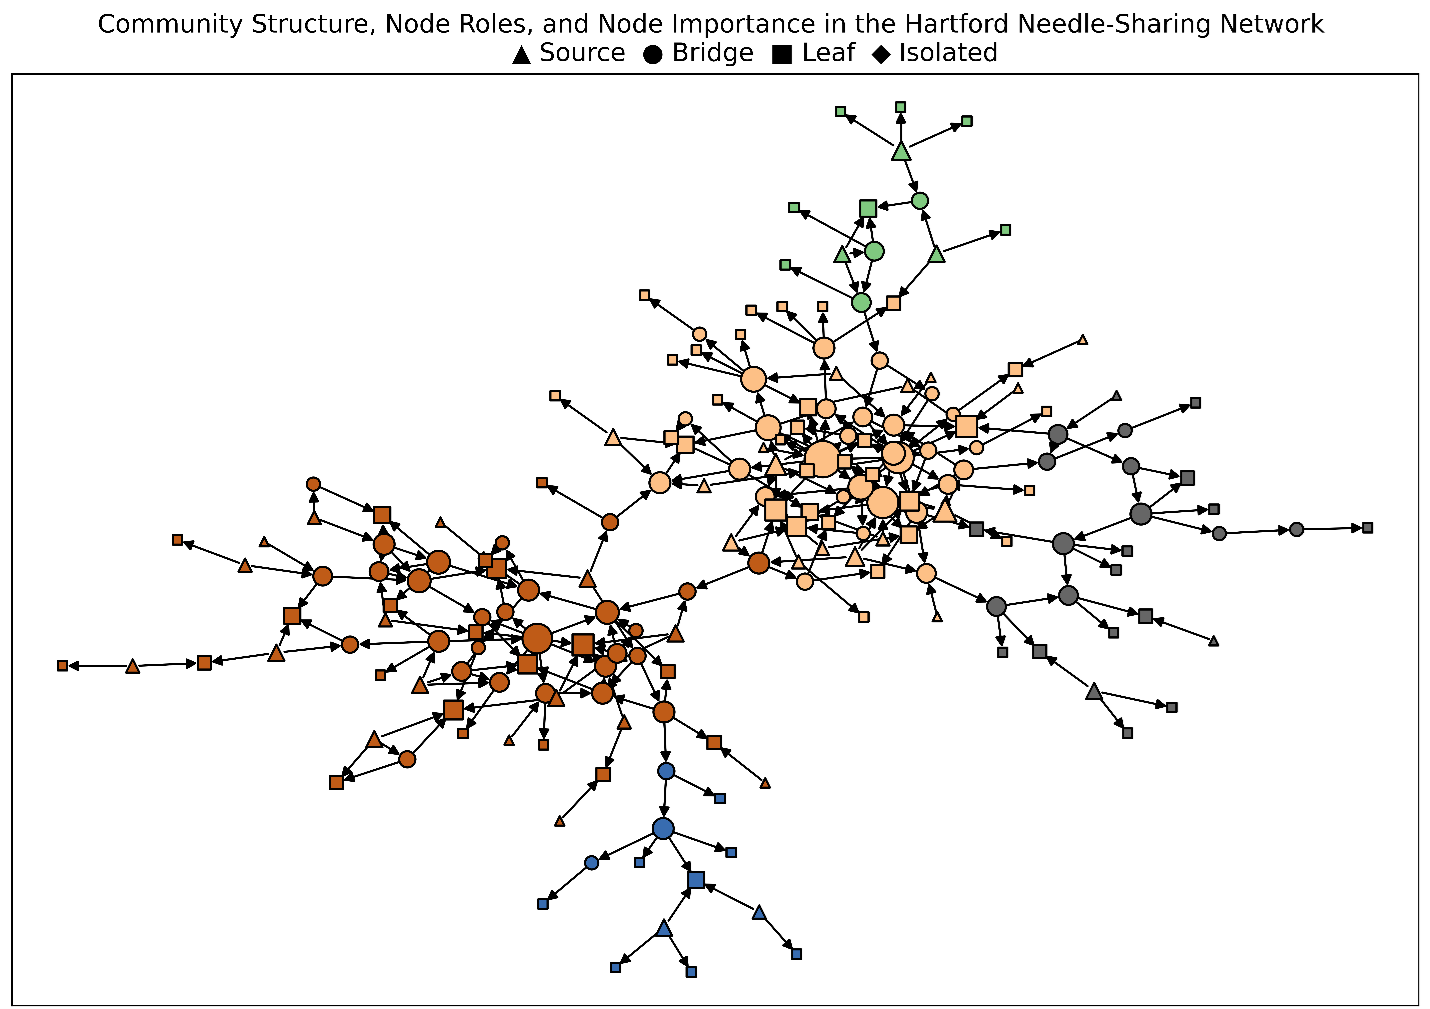
%PlotGraph( links=mycas.DrugNetwork, nodes=mycas.NodesOutEnriched, direction="directed", nodescolorbycategory="community_0", nodesshape="shape", nodessize="centr_degree_scaled", displaylabels=no, title="Community Structure, Node Roles, and Node Importance in the Hartford Drug User Needle-Sharing Network \n ▲ Source ● Bridge ■ Leaf ◆ Isolated"); |
In Figure 4, node size reflects relative influence. Node color indicates community membership. And node shape represents an individual’s functional role within the network. Bringing these dimensions together in a single visualization enables users to explore the network more intuitively. This makes it easier to identify influential individuals within and across communities. It also helps to understand how roles differ within groups and see how interactions are organized across multiple levels of the network.
Conclusion
This analysis demonstrates how network analytics can transform a simple link list into actionable insights for public health decision-making. By using the SAS Viya NETWORK action set, we identified influential individuals based on degree-based influence. We distinguished functional roles, including sources, bridges, leaf nodes, and isolated nodes, and uncovered community structure within the network.
By combining node influence (size), community membership (color), and functional role (shape) in a single visualization, we focus on a holistic view of how risk might originate, propagate, and terminate across the network. This integrated perspective enables more informed intervention strategies that move beyond uniform approaches. It instead focuses on individuals and subgroups that play disproportionate roles in network dynamics.
The workflow presented here also provides a foundation for extending the analysis as additional questions or data become available. Network analytics can support targeted, community‑based interventions and incorporate temporal or weighted relationships to reflect changes in behavior over time. It can also explore alternative measures of influence or risk through additional centrality metrics and ego-network analysis. Integrating domain-specific attributes such as demographics, location, or intervention history can further enhance context-aware targeting and support more informed decision-making.