R first appeared in 1993 and has gained a steady and fiercely loyal fan base. But as data sets become both longer and wider, storage and processing speeds become an issue. Having spent weeks whipping an extremely wide and messy data set into shape using only R, I am so grateful for SAS Viya and not having to go through that again. SAS Viya is a cloud-enabled, in-memory analytics engine which allows for rapid analytics insights. SAS Viya utilizes the SAS Cloud Analytics Services (CAS) to perform various actions and tasks. Best of all, CAS is accessible from various interfaces including R. In this blog, I will go through a few blocks of one of my notebooks, which moves through an analytics workflow using R and SAS.
Getting Started
The Scripting Wrapper for Analytics Transfer, also known as SWAT, is a package that allows R users to access the power of the SAS Cloud Analytic Service (CAS) from a familiar R interface. The SWAT package is available to SAS Visual Analytics (VA), SAS Visual Statistics (VS), and SAS Visual Data Mining and Machine Learning (VDMML) users. To begin working with SWAT, download and install the package from the SAS Software GitHub page. Next, you can call it in your code using the library function.

Now, you just need to create your connection to CAS. Important note: you must have credentials to SAS Viya to access CAS! Once you have everything you need, you can connect to CAS in one line of code.

Next, you can load your action sets. Action sets are like packages, but are specific to CAS.

Loading Data: The Perks of In-Memory
The next move is to load our data into CAS. CAS is able to load data into memory and run CAS actions in-parallel, which means that CAS can take on massive data sets while remaining lightening fast! My extremely messy and wide data set would have been no problem for CAS, but alas, those weeks of my life have already been sacrificed to R. Anyway, CAS can take in numerous kinds of data from SAS7BDAT files to CSV files in one line of code.

Exploring and Cleaning Data
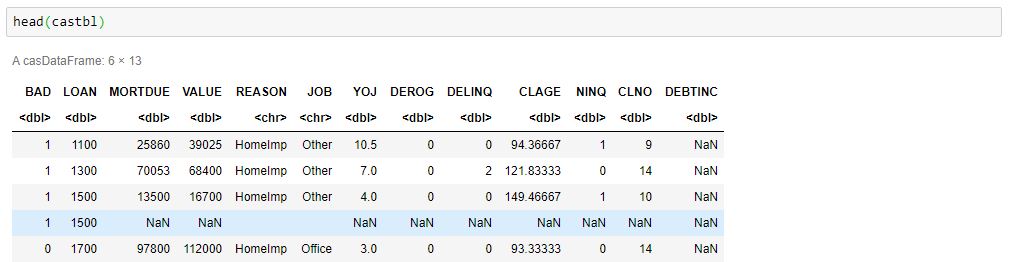
Once data is loaded into CAS, it is stored as a CAS table, not a data frame. But this doesn't mean you can't interact with it in a similar way. Many of the data exploration functions for R data frames will still work on CAS tables.
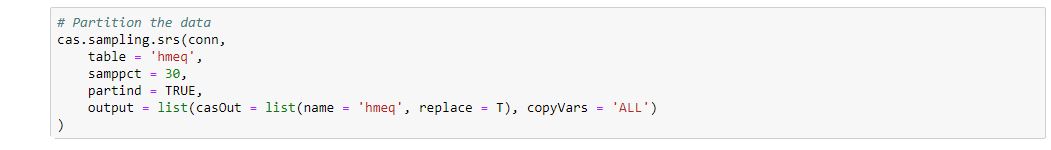
Before we begin modeling, we need to partition our data into training and testing data sets. We can create a simple random sample using the Sampling and Partitioning Action Set and specify that we want to use 30% of our data for testing.
Building and Assessing a Classification Model
Our data is ready for modeling. We will start by training a decision tree model using our training data set. We will use the Decision Tree Action Set to train and score the tree. To build the tree, we point the action to our training data, and give it the target, input variables, and nominal variables. When you work with character variables in SAS, there is no need to build out dummy variables or perform any one-hot encoding. All you need to do is specify these variables using the nominal parameter, and SAS will handle the rest.

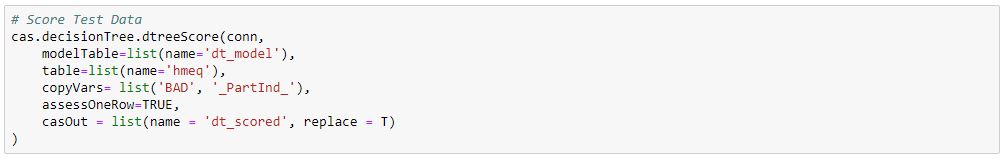
Next we can score the holdout data by giving the data and model back to the decision tree action.
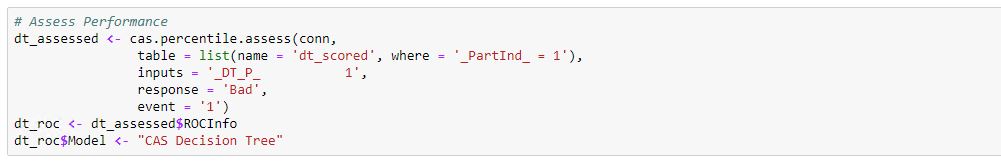
Now we have a model, and we have scored our holdout data, so lets examine how the model did. We will use the assess function from the Percentile Action Set to automatically build numerous assessment statistics. This action is limited to models built in SAS. You can also pass in the data scored by your R models to begin an apples to apples comparison of all your models.
Finally, we can use grab various assessment statistics from the results, such as the misclassification rate.

A misclassification rate of .14 isn't bad, but we can do better!
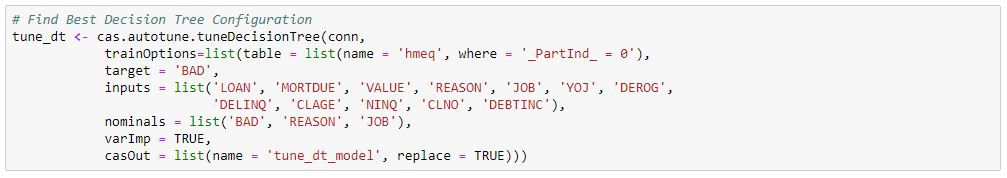
Autotuning Models
Machine learning models have a ton of different options to configure for building the best model specific to your needs. But how can you know which configuration is best? No one wants to sit there and try every possible combination of hyperparameters. The good news is that you don't have to! The Autotune Action Set will search through the various combinations of hyperparameters and find the combination that reduces error. The process and code to create and use an autotuned decision tree looks very similar to the process we used to create a decision tree. First, you must load the Autotune action set, train the model, score the hold out data, and assess the model.
Want to Learn More?
In this blog, we went through a basic analytics workflow, but there is a lot more you can do with the power of SWAT and R! Check out SAS Viya: The R Perspective as an introduction to working with R and SAS. Next, the SAS Software GitHub page is a great place to check for example code! From GitHub, you can find the code files to accompany SAS Viya: The R Perspective as well as notebooks for machine learning and programming. The blocks of code featured in this blog can be found in this notebook.