A previous post, Spatial econometric modeling using PROC SPATIALREG, introduced the SAS/ETS® SPATIALREG procedure and demonstrated its usage to fit both linear and SAR models by using 2013 county-level home value data in North Carolina. In most analysis for spatial econometrics, you rarely know the true model from which your data are generated and hence you need to explore many other models in order to choose a model. As a general guideline for model selection, you first narrow your choice of models down to a set of candidate models, fit these models, and then identify the model that best describes the data according to certain criteria. This post describes other spatial models that you can fit and illustrate how to use multiple MODEL statements in the SPATIALREG procedure to facilitate model selection in spatial econometrics.
For the purpose of illustration, this post uses the same 2013 North Carolina county-level home value data that was used in the previous post. The data set is named NC_HousePrice and contains five variables: county (county name), homeValue (median value of owner-occupied housing units), income (median household income in 2013 in inflation-adjusted dollars), bachelor (percentage of people in the county who have a bachelor’s degree or higher), and crime (rate of Crime Index offenses per 100, 000 people). Before you proceed with spatial econometric analysis, you need to create a spatial weights matrix. For convenience, consider a first-order contiguity matrix W where two counties are neighbors to each other if they share a common border.
To fit a spatial Durbin model (SDM) to the NC_HousePrice data, you can submit the following statements:
   proc spatialreg data=NC_HousePrice Wmat=W;
      model Hvalue=Income Crime Bachelor/type=SAR;
      spatialeffects Income Crime Bachelor;
      test _rho=0/all;
      spatialid County;
   run;
You supply two data sets—the primary data set and a spatial weights matrix—by using the DATA= option and the WMAT= option, respectively. The primary data set contains the dependent variable, the independent variables, and possibly the spatial ID variable. In the MODEL statement, you specify the dependent variable y and regressors x. You use the TYPE= option to specify the type of model to be fit, selecting one of the following values: SAR, SEM, SMA, SARMA, SAC, and LINEAR. For example, you specify TYPE=SAR to fit a SAR model and TYPE=LINEAR to fit a linear regression model. You use the SPATIALEFFECTS statement to specify exogenous interaction effects. In the preceding statements, you specify TYPE=SAR together with the SPATIALEFFECTS statement to fit an SDM model. The TEST statement in PROC SPATIALREG enables you to perform hypothesis testing. The SPATIALREG procedure supports three different tests: likelihood ratio (LR), Wald, and Lagrange multiplier (LM). The SPATIALID statement enables you to specify a spatial ID variable to identify observations in the two data sets that are specified in the DATA= and WMAT= options.
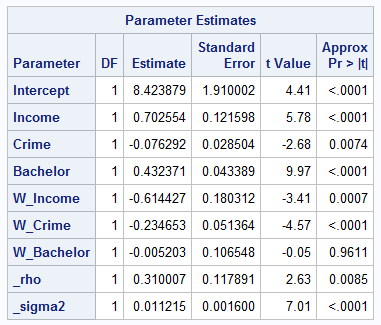
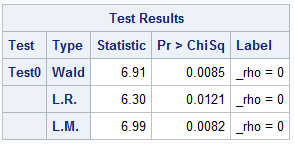
For the SDM model fitted to the NC_HousePrice data, the value of Akaike’s information criterion (AIC) is –144.96. The results of parameter estimation from the SDM model, shown in Table 1, suggest that three predictors—income, crime, and bachelor—are all significant at the 0.05 level. The spatial correlation coefficient ρ is estimated to be 0.31 and is significant at the 0.05 level. Table 2 shows the test results for H0: ρ = 0 from the three tests. According to the test results, you can conclude that H0 should be rejected at the 5% significance level. In other words, there is a significantly positive spatial correlation in house price.
To fit a spatial error model (SEM) to the NC_HousePrice data, you can submit the following statements:
   proc spatialreg data=NC_HousePrice Wmat=W;
      model Hvalue=Income Crime Bachelor/type=SEM;
      spatialid County;
   run;
The results of parameter estimation from the SEM model, shown in Table 3, suggest that two out of three predictors—income and bachelor—are significant at the 0.05 level. The value of AIC for this model is –122.68. The spatial correlation coefficient λ is estimated to be 0.60 and is significant at the 0.05 level. As a result, there seems to be a significant positive correlation in the disturbance.

So far, SDM and SEM models have been fitted to NC_HousePrice data. The SDE model is capable of accounting for both endogenous and exogenous interaction effects, whereas the SEM model can account for spatial dependence in the disturbance term. The comparison of AIC values between these two models suggests that the SDM model is better than the SEM model because the SDM model has a smaller AIC value. However, you might want to try a more complicated model—such as a spatial autoregressive confused (SAC) model—that can address endogenous interaction effects, exogenous interaction effects, and spatial dependence in the disturbance term.
You can fit an SAC model to the NC_HousePrice data by submitting the following statements:
   proc spatialreg data=NC_HousePrice Wmat=W;
      model Hvalue=Income Crime Bachelor/type=SAC;
      spatialid County;
   run;
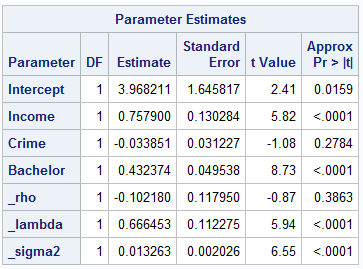
Table 4 shows the results of parameter estimation from the SAC model. As in the SEM model, only two predictors—income and bachelor—are significant at the 0.05 level. The value of AIC for this model is –121.43. The spatial correlation coefficient ρ is estimated to be –0.10, but it is not significant at the 0.05 level. However, the spatial correlation coefficient λ is estimated to be 0.67 and is significant at the 0.05 level.
Among the three models that have been considered for the NC_HousePrice data, the SDM model is the one with the smallest value of AIC. As a result, if you have to choose the best model among SDM, SEM, and SAC models according to AIC, the SDM model would be the winning model. Since model selection is common in most data analysis, PROC SPATIALREG facilitates model selection by enabling you to use multiple MODEL statements to fit more than one model at a time. For example, you can fit the preceding three models to NC_HousePrice data by submitting the following statements:
   proc spatialreg data=NC_HousePrice Wmat=W;
      model Hvalue=Income Crime Bachelor/type=SAR;
      spatialeffects Income Crime Bachelor;
      test _rho=0/all;
      model Hvalue=Income Crime Bachelor/type=SEM;
      model Hvalue=Income Crime Bachelor/type=SAC;
      spatialid County;
   run;
This post introduces how to fit spatial econometric models that are available in the SPATIALREG procedure. These models include the spatial Durbin model (SDM), spatial error model (SEM), and spatial autoregressive confused (SAC) model. It also describes how you can use multiple MODEL statements in only one call to PROC SPATIALREG to facilitate model selection. In the next blog post, we’ll talk more about how to create spatial weights matrices for spatial econometric analysis. We will also be giving a talk, "Big Value from Big Data: SAS/ETS® Software for Spatial Econometric Modeling in the Era of Big Data," at the SAS Global Forum conference April 2-5, 2017, in Orlando. Stop by and let's talk about spatial econometrics!