The date of Easter influences our leisure activities
 Different from many other public holidays, Easter is a so-called movable holiday. This means that the Easter bunny brings more than just eggs for the statistician - he brings special Easter forecasting challenges. In the year 325 CE the Council for Nicea determined that Easter would fall on the Sunday after the first full moon in spring. The earliest date for Easter is thus March 22nd, the latest April 25th. Carl Friedrich Gauss took this rule into consideration and developed the Gauss algorithm for Easter, which allows the determination of the date of Easter for a given year.
The moving date of Easter matters, because this holiday has a very strong influence on our leisure activities. Many people use the feast of Easter to take a spring holiday, which in turn has a strong impact on the hotel, restaurant, and transportation industries. Our choice of activities also depends on the timing of Easter. For many of my fellow Europeans, when Easter falls at the end of March, we may plan a ski vacation, while an April date may call for plans that involve enjoying the warming spring weather instead of seeking the snow.
Analysis of the data mirror that behavior
Time series data on a monthly basis reflects this behavior. In a multi-year observation you often see that the peaks switch between March and April.
- When Easter falls in March, winter sports resorts in the Austrian Alps often have a full hotels in that month. In April, however, occupancy drops very sharply, because Easter often also means end of the season for the ski lifts.
- The effect of the importance of the Easter holidays can also be observed by the number of air and rail travelers or visitors to recreational facilities.
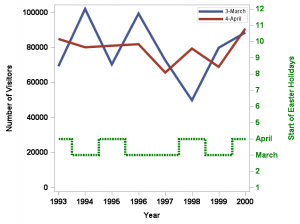
The following graph shows the number of visitors at a leisure park during the period from 1993 to 2000. In order to facilitate recognition, only the months March (blue) and April (red) are shown. In addition a green step curve shows whether the beginning of the Easter falls in March or April in each year.

It is easy to see that for a holiday that starts in March, the blue line is higher than the red line. For a holiday that starts in April, the reverse is true. We can clearly see the behavior of consumers and tourists can in our analysis of the data.
In the evaluation of results, the consideration of this fact is important. From a sales perspective it does not make sense, to panic when the March sales fall behind those of the previous year when the "Easter Peak" is expected only in April.
Easter forecasting challenges
A peak that varies between March and April can be a problem for time series forecasting models. Many simple time series models only use the historical values of the time series. If Easter falls in April in two consecutive years, the models expect the next peak again in April, because the model has only learned the seasonal effect, leading to these Easter forecasting challenges.
This fact is important because there is an increasing trend for planning software packages to offer only a few simple standard methods of time series forecasting. For some applications a simple seasonal exponential smoothing model does quite well. But it takes a little more effort to consider the above situations. You do not want to manually correct your budget figures every time for the “Easter effect.” It is tedious to always explain your own numbers in a planning meeting with the caution,"Yes, but this year...."
Event, inputs and flexible time intervals make a difference
The forecasting solution from SAS is built to consider these points for you:
- Automatic model selection checks for you whether the time series can be forecast with a simple model or whether a more powerful model should be used.
- Your individual data are analyzed to select the most appropriate model from a model library and fit it to your data.
- The forecast considers input variables like the number of workdays, Saturdays, or Sundays, as well as already-booked orders.
- Pre-defined calendar events like Easter or Christmas can be considered in the analysis.
- You can define individual events that are important for your company or organization that influence the course of your key performance indicators.
- You have the possibility of adapting the length of time intervals to the seasonal pattern of your processes.
Next year, Easter takes place on March 27th; in 2017 it will fall on April 16th. Check now to see whether your forecasting software and the resulting forecast numbers consider this shift.
SAS Global Forum, another moveable date
Another event that has a moving date is SAS Global Forum. This year it takes place April 26th-29th in Dallas, Texas.
My paper, “Want an Early Picture of the Data Quality Status of Your Analysis Data? SAS® Visual Analytics Shows You How“ is scheduled for Wednesday, April 29th, 10:00-10:50 a.m. (Preview the A2014 Demo Version). I look forward to meeting you there!


