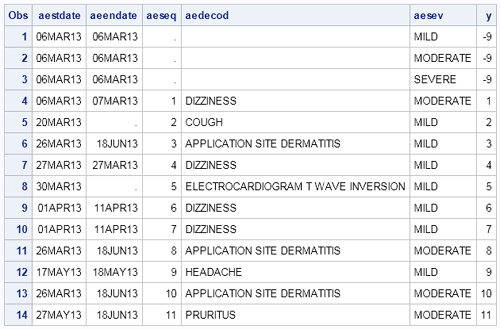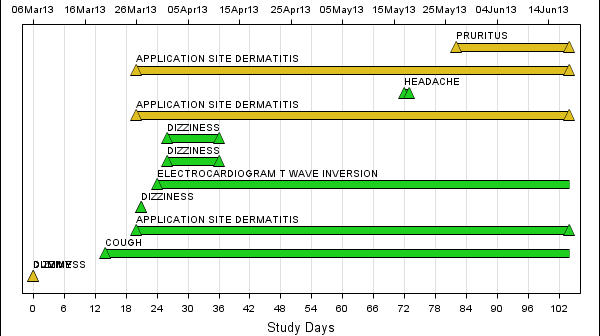
The Adverse Event Timeline graph posted earlier used the MARKERCHAR option of the SCATTER plot to draw the AE names. This option places a center-justified label at the marker position. There is no option in SAS 9.2 version to right-justify the label. Hence, we have to compute an offset in data

