Tips and Tricks

Data Visualization | Learn SAS | Programming Tips
Sanjay Matange 2
New features with SAS 9.40 M5

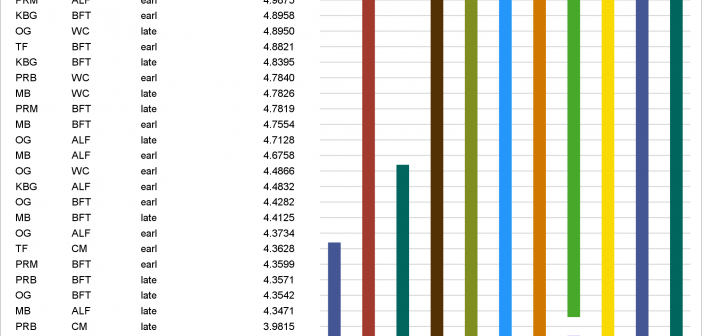
SAS 9.4 maintenance release 5 was released on Sept 19, 2017.  This release includes many new items including integration with SAS Viya and SAS Studio, a web application for SAS development.  Also Included with this release are some cool new features in the graphics domain, some of which were requested

Analytics | Data Visualization | Learn SAS | Programming Tips
Sanjay Matange 0
Getting started with SGPLOT - Part 8 - Horizontal HighLow Plot

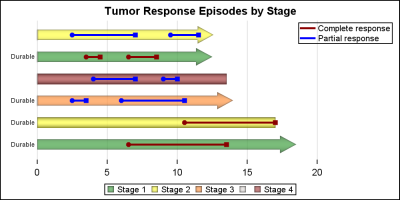
On a recent visit to an In-House Users Group meeting at a Pharmaceutical company, I presented a 1/2 day seminar on creating Clinical Graphs using SG Procedures.  Polling the audience for their experience with these procedures indicated that many SAS users are not familiar with these new ways to create graphs. So,

Data Visualization
Sanjay Matange 4
Stock chart

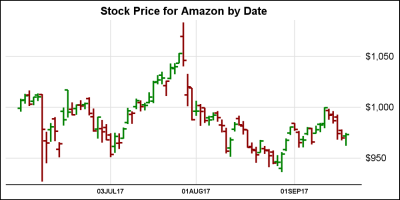
In the previous article on Getting Started with Vertical HighLow Plot, I described how we can use the HighLow plot to display the stock price by date.  The HighLow plot is specifically designed for such use cases as shown below. The data is downloaded from the Nasdaq web site, and

1 4 5 6 7 8 35