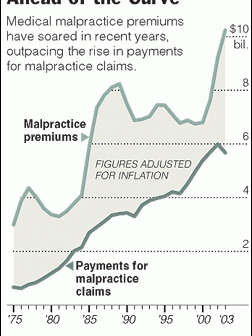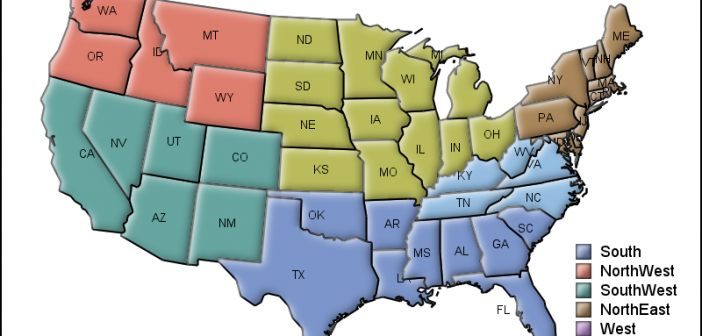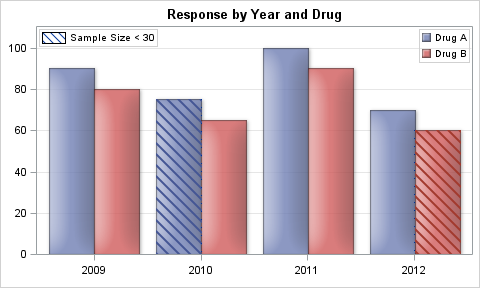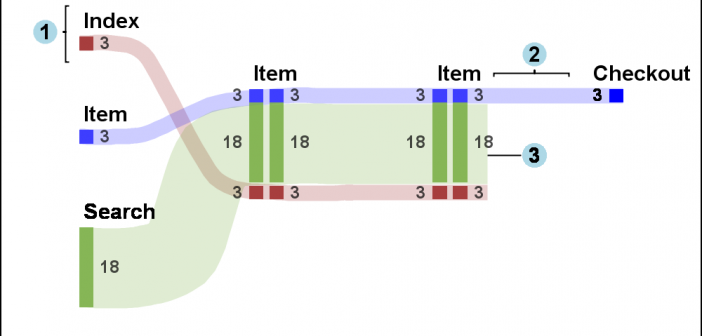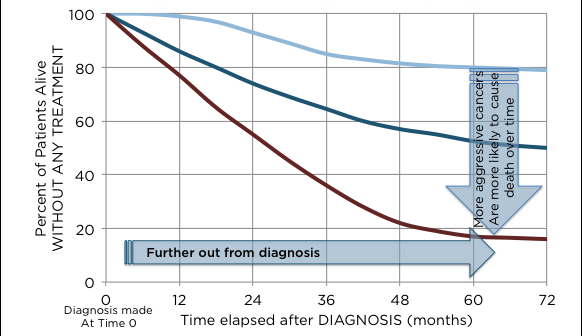
The SGPLOT procedures includes features to add annotations to your graph in many different ways. Annotations provide you a flexible way to add features to your graph that are not available through the standard plot statements. Recently, I saw this graph on the web that caught my attention. Clearly, this looks like


