I hope you're all doing well, in this year of plagues and locusts! I'm sure I don't even need to mention which plague I'm talking about. But what about the locusts? Are you up on your entomological studies? Follow along, and see if you really know what locusts are...
Locusts ... You've probably heard of locusts before. They're basically grasshoppers. They fly around in swarms of thousands, and eat plants. And when the plants they're eating happen to be in the fields where farmers are trying to our grow food, they can cause famines. There are swarms of locusts this year in certain parts of the world, but that's not what this blog post is about. 🙂
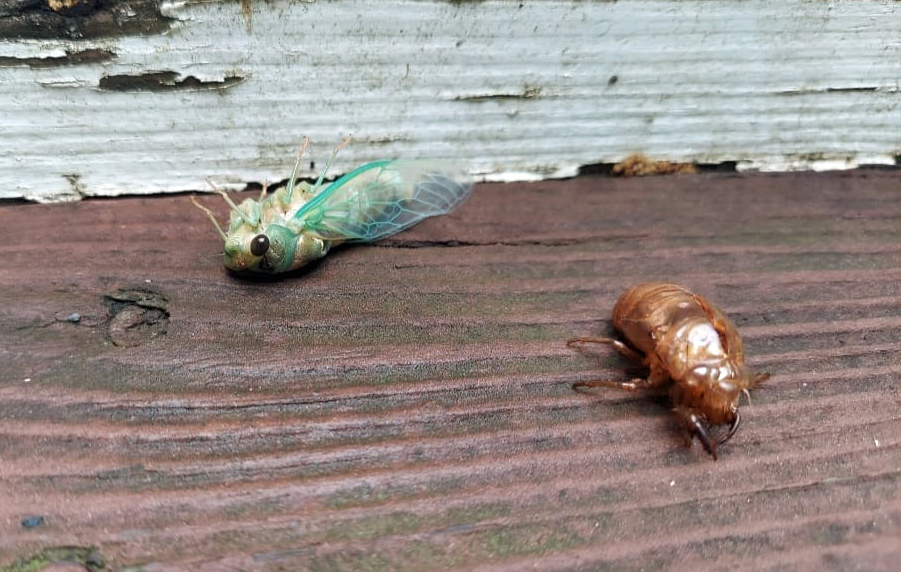
Cicadas ... Many people (incorrectly) call cicadas locusts. Cicadas resemble large flies, but are about 2 inches long and quite hefty. They spend many years underground as larvae, then emerge to shed their shell and spread their wings. They climb a tree, sing their song (very loudly), mate, lay eggs, and then die. Here's a picture of a cicada that recently emerged from its shell, from my outdoorsy friend Patricia:
Cicada Broods Map
Here in the US, some groups of cicadas have a 17-year life cycle, and some have a 13-year one. Liebhold, Bohne, and Lilja (USDA Forest Service Northern Research Station, Northeastern Area State and Private Forestry) created the following map showing the Active Periodical Cicada Broods of the United States. As you can see in the map, Brood X has emerged in the yellow counties this year (2021).
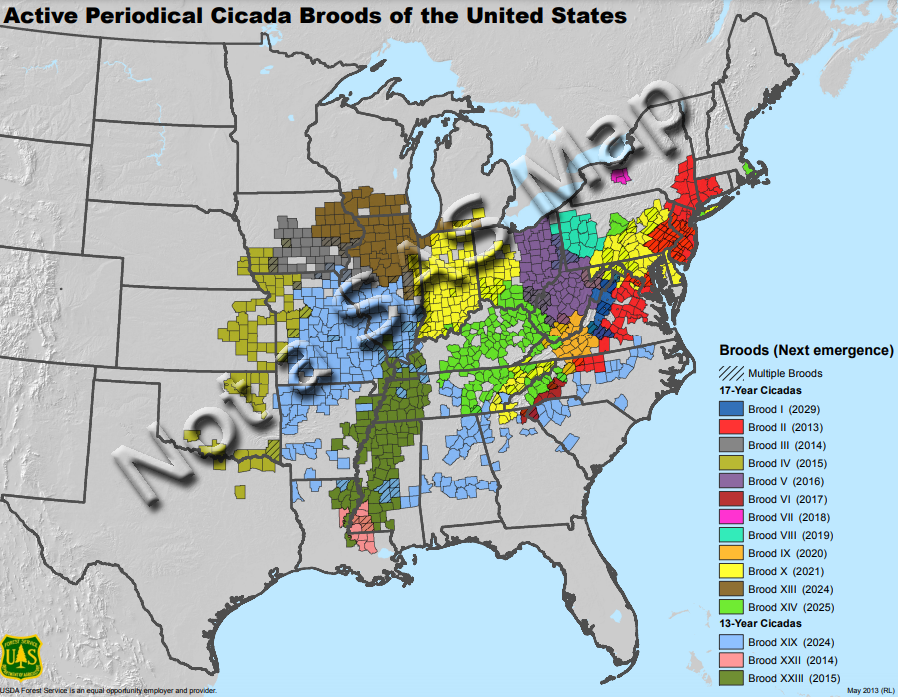
Although the map has more colors than I would typically try to show on a map, I think they did a pretty good job. One thing that makes this data difficult to plot is that some counties have more than one brood of cicadas. The map above represents those counties by coloring the county based on just one brood, and then overlaying a hatch-mark pattern. That technique has a couple of drawbacks though:
- The single brood color visually biases the map towards that brood.
- The hatch marks can sometimes look like county borders.
It was interesting data, and I had some ideas for improvements, therefore of course I set out to create my own version, using SAS Software. See my map below. Based on this map, are there any cicada broods in the area where you live? What year will they emerge?
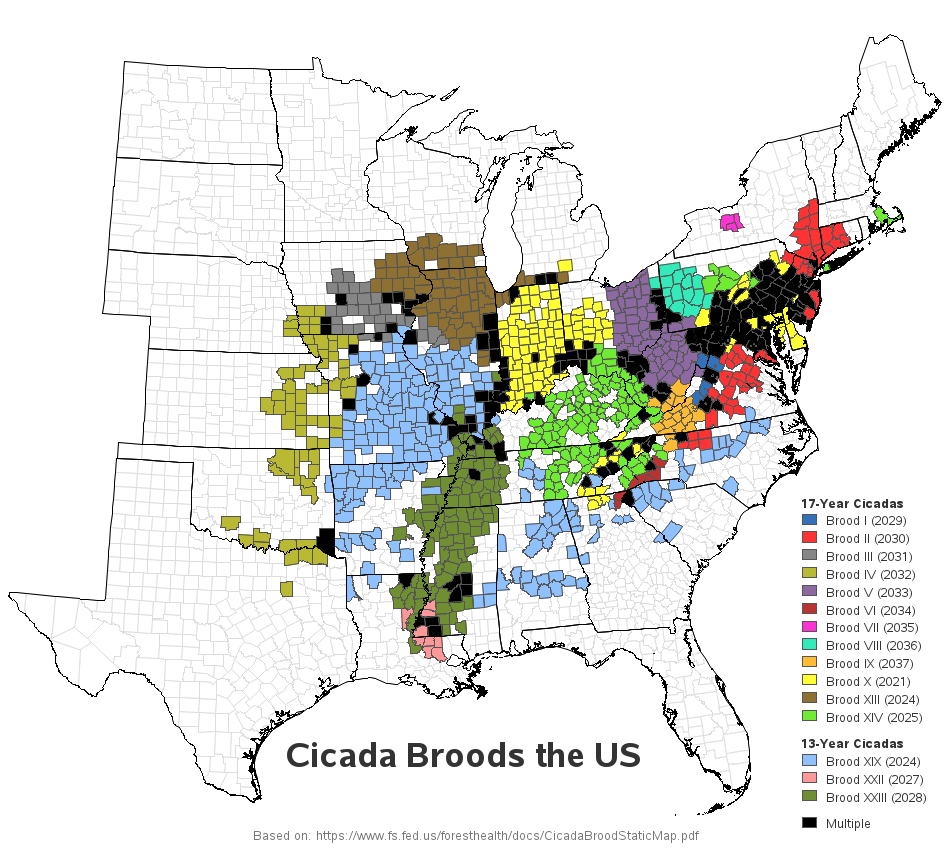
In my SAS map, I made the following changes (hopefully improvements):
- I used solid black to show counties with multiple broods. This way it's not biased towards any one brood color, and it doesn't have hatch lines that could be mistaken for county borders.
- I moved the main title to the bottom, so it's easier to see all the explanatory text on one screen.
- I include (very light gray) county outlines for the counties that do not have cicada broods. I think this helps the users get their bearings, with extra points of reference.
- I leave out the background tile map (which shows North America and the ocean/water), to reduce the number of colors on the page competing with the data colors.
- I included a footnote to let users know the data source.
Cicada Broods Animation
Rather than showing all the broods on one static map, it's also interesting to show them one year at a time in an animation. Here's a screen-capture of an animation jaxsonp10 posted on reddit. Click the image to go to reddit and see the animation.
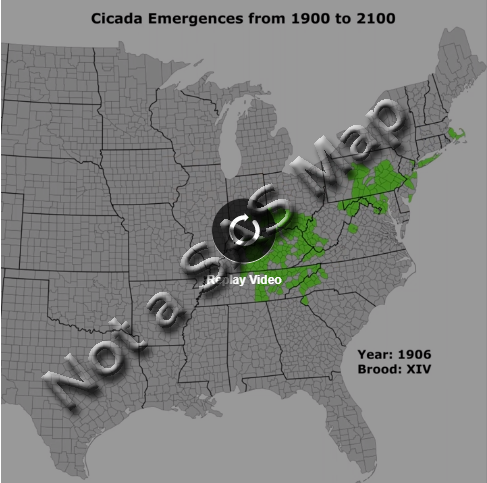
Their animation is interesting, but I think it runs a little too quickly, and I kind of miss seeing the color legend. Therefore I created my own version, which hopefully improves on those two things. The blog host has a 1MB file size limit, so here's a shortened version of my animation - click it to see a longer animation that included many more years.
In the animation, I enhanced the static map by adding the year to the title (to the west of Florida), and I highlight the brood(s) in the legend which are active that year by making the brood name bold, and adding a '>' to point to that brood.
And now you know that locusts and cicadas are different, and you know when & where the different broods hatch in the US! (Quick quiz! ... after 2021's Brood X, what is the next year & brood we'll see, and what part of the US will it be in?)
Code
In case you're a SAS programmer, and curious about how I created the maps above, here's the code for my static map, the animated map, and the data.


1 Comment
Very interesting. I had always thought cicada was just another name for locust. Now I know that I was picking up shoe boxes full of the cicada shells in southwest Virginia when I was a child. I thought it amazing that they could successfully shed their shell and it still looked very much like like the insect that had lived in it. I remember the shells crunching under my feet when I walked in the woods at the conclusion of their 17-year cycle. I enjoyed reading your blog, and the graph is easy to understand. Well done!