North Carolina is one of those key "swing states" that might possibly decide a national presidential election. And with such an election coming up next year (2020), I thought I would have a look at the voter registration data to see how it has changed since the previous presidential election (2016).
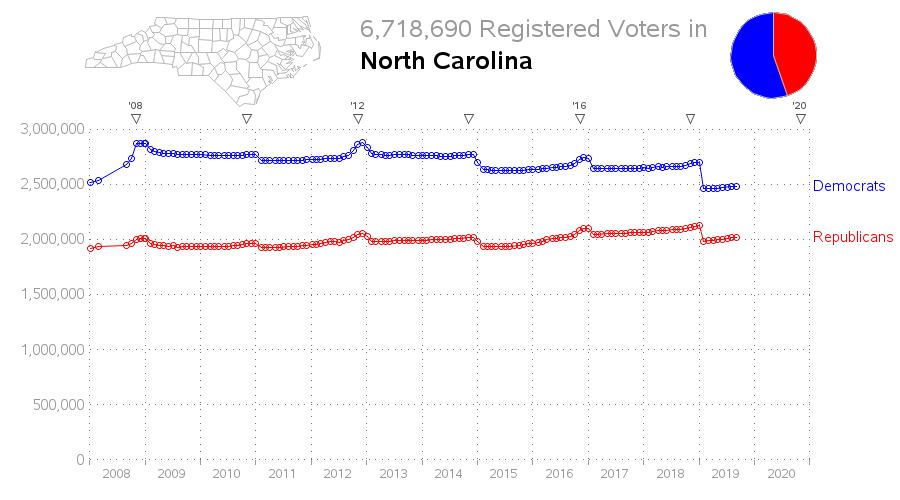
I downloaded monthly snapshots of the registration data for the past several years, imported the files into SAS, and started plotting... Below is a graph showing the number of registered Democrats & Republicans since 2008 (Obama's first presidential election). You'll notice that voter registration drives before each election bump up the number of registered voters right before each election, and then the voter registration lists are cleaned after each election (you have to be inactive and non-responsive for several years before your registration is dropped).
It looks like the number of Republicans has held steady during those years (with perhaps a slight increase). And the number of Democrats had a big increase during the 2008 voter registration drives, but has declined back down to about the pre-2008 numbers now (with perhaps a slight decrease). And there are currently about 500,000 more registered Democrats than Republicans.
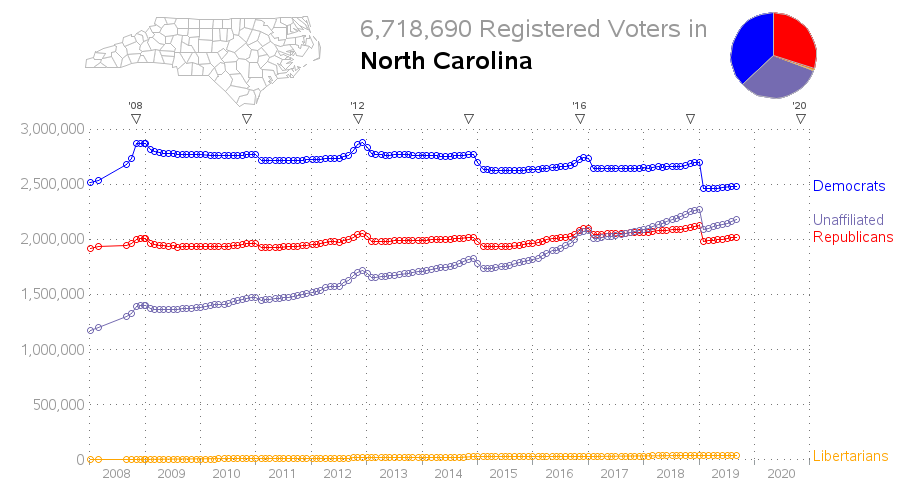
But wait - is that the whole voter registration story?!? ... Not quite! What about the people who registered neither Democrat nor Republican? If we add them to the graph, we see that the number of people registered Unaffiliated is a formidable voting force. It actually became higher than the number of Republicans around the 2016 election. And a quick glance at the pie chart shows that the Republicans and Unaffiliated combined outnumber the Democrats.
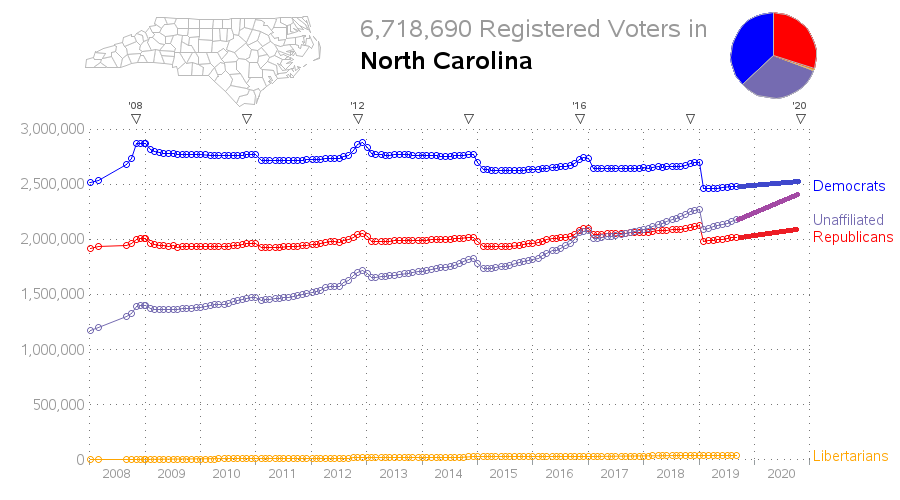
Glancing at the graph above, it looks like the number of Unaffiliated might even be higher than the number of Democrats by the 2020 election (the triangle markers along the top edge of the graph denote the election dates). It's impossible to say exactly how voter registration trends will continue into the future, but out of curiosity I extended the current trends into the future using straight lines. With the straight line forecast, it looks like the number of Unaffiliated might still be slightly lower than the number of Democrats at the 2020 election. (But with voter registration drives right before the election, the lines won't actually be straight - so you never know!)
Of course, the big question ... will the Unaffiliated vote for Democrat or Republican candidates? (or neither, or both?) Some people have tried to determine this with surveys and exit polls, but history has told us you can't really rely on such methods. Many of my friends tell me that they don't respond to surveys and exit polls, or they intentionally give misleading responses. So, the only thing I can predict with certainty is that 2020 will be an 'interesting' election year in North Carolina. 🙂
What are your theories about voter registration, and the 2020 election? (feel free to discuss in the comments)


10 Comments
It would be interesting to see how the registration numbers correspond to _actual_ vote totals at election time (Prez, Guv, USSen).
Maybe aggregate totals for USHouse and NCGA, too, although mapmaking will have an effect on aggregate totals. For instance, I have a personal policy to never vote for someone running unopposed.
Sounds like a reasonable idea...
Very interesting.
Knowing the demographic info about the unaffiliated as compared to other groups would be interesting.
Yes - if someone has a 'crystal ball' and can figure out the unaffiliated voters, that knowledge will be worth a great deal in future elections!
The analysis I have seen is that most of the unaffiliated voters lean heavily either to Democratic or Republican candidates in their voting patterns. They are not really ticket-splitters or vote 3rd party. They just don't want to have a party label. That's true also in other contexts such as religious affiliation, etc.
Do you have any examples/links to these studies?
One thing to note is that, some years ago, NC changed the voting laws to allow unaffiliated voters to vote in any primary they chose. Before that, one had to be affiliated in order to vote in the primary. In many voting areas, the local vote is entirely decided in the primary. I first registered as unaffiliated (they called it independent then) and found I had no say in the elections in my city so I switched my registration. That could explain part of the relatively rapid rise in unaffiliated voters.
Thanks for sharing these details! I love learning these kinds of morsels of info, that might help explain why the data is doing what it's doing. 🙂
Do you have any comment on huge drop-offs after the 2018 voting? Was the largest cleaning done, namely, dropping by reasoning of inactivity or whatever justification? Thanks.
I have two theories regarding drops in voter registration, from the cleanup of the voter registration databases ...
Theory 1: A lot of people got excited about politics, and registered to vote for the 2008 election. After that, a lot of them lost interest, and have finally become non-active/non-responsive for long enough that they have been removed from the voter registration.
Theory 2: The government has finally gotten more serious about cleaning up the voter registration databases, and getting rid of the voters who are non-active, non-responsive, dead, have moved, or are otherwise not eligible to vote (such as illegal aliens). Also, as people are getting their 'real id', I suspect people who previously had multiple id's in multiple states (and were possibly registered to vote in multiple states), and now having to decide on a single state & id.
These are just theories, of course - it would be difficult to confirm them with data! 🙂