All Posts
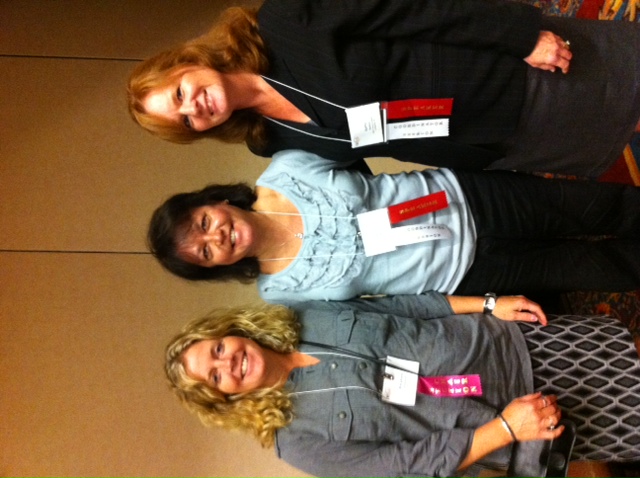

Kathleen Harkins, Carolyn Maass and Mary Anne Rutkowski, from Merck Sharp and Dohme, collaborated to write T.I.P.S: Techniques and information for programming in SAS® for NESUG 2011. These three women are highly experienced programmers: Harkins has more than 20 years of experience in the pharmaceutical and aerospace industries; Maass has


The downturn in the economy beginning in 2008 and continuing even to now has put tremendous pressure on local governments to do “less with less”. In the past when economic downturns caused service level cut backs the cry was to do “more with less”. The idea was to identify ways


I use Google Reader to keep up with SAS-related conversations on the blogosphere. I thought it would be nice to share the lists of blogs that I follow as "shared bundles". If you also use Google Reader, it will be very easy for you to add these bundles to

‘Context’ defined (as cited from the Merriam-Webster Online Dictionary): 1: the parts of a discourse that surround a word or passage and can throw light on its meaning; and, 2: the interrelated conditions in which something exists or occurs: environment, setting. While context is clearly important, today it is consistently
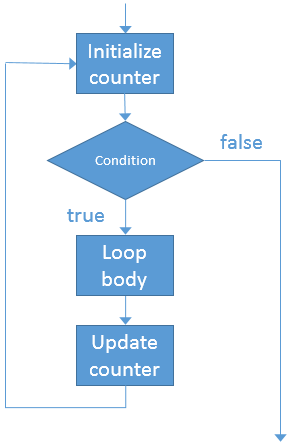

Looping is essential to statistical programming. Whether you need to iterate over parameters in an algorithm or indices in an array, a loop is often one of the first programming constructs that a beginning programmer learns. Today is the first anniversary of this blog, which is named The DO Loop,
It's been a well-known limitation for a long time. When you connect to a SAS session using SAS Enterprise Guide, shell commands (including X command, SYSTASK, and FILENAME PIPE) are off-limits because the default SAS invocation disables them. It does this by including -NOXCMD as a command-line option. This makes

Hurricane Irene impacted 20% of the US population and will cost billions in recovery dollars. Now that the water has begun to subside, the real long term work begins. And it is this work that can be another disaster, or, a real economic benefit to a state. How so? FEMA

I recently attended the Medicaid Management Information System (MMIS) Conference in Austin, Texas. The MMIS conference is an annual event for federal and state HHS agencies to share programmatic and technology initiatives in Medicaid and Children’s Health Insurance Programs (CHIP). While I have attended numerous MMIS conferences in the past, I

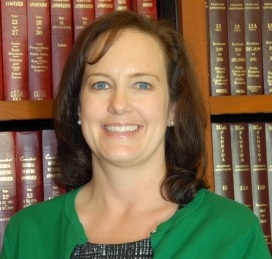
You’ve gotten to know Stacey Hamilton; now it’s time to learn more about SAS Press acquisitions editor John West! John West typically works on programming and statistics titles and has been with SAS Publishing for 22 years: He started at SAS as a proofreader, then moved into technical editing where

While talking to SAS users in Australia earlier this month, I often demonstrated the capabilities of the new Map Chart task in SAS Enterprise Guide 4.3. Creating map charts has never been easier: select your map data source, then select your response data source, and click Run. Voila! You've got

One of the highly visible changes in SAS 9.3 is the fact that the old LISTING destination is no longer the default destination for ODS output. Instead, the HTML destination is the default. One positive consequence of this is that ODS graphics and tables are interlaced in the output. Another
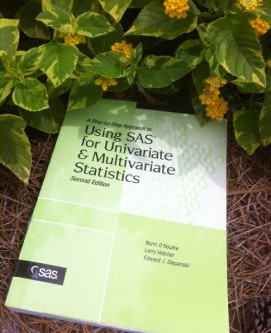

This week's SAS author's tip comes from a large green book that many of you are familiar with: A Step-by-Step Approach to Using SAS for Univariate & Multivariate Statistics, Second Edition by Norm O'Rourke, Larry Hatcher, and Edward J. Stepanski. Despite its massive size, this isn't an intimidating text. The authors ease you

The recent budget debate between President Obama and Congress reminded me of many of the discussions I observed during my years as State Controller and Deputy State Budget Officer in North Carolina. These discussions are related specifically to principles adhered to in budget development and budget deliberations by elected officials.

You can generate a set of random numbers in SAS that are uniformly distributed by using the RAND function in the DATA step or by using the RANDGEN subroutine in SAS/IML software. (These same functions also generate random numbers from other common distributions such as binomial and normal.) The syntax

The highway system traversing the United States quietly hit a milestone last month with the 55th anniversary of the Federal Aid Highway Act. In 1956 President Eisenhower had a vision for our nation’s infrastructure; he knew that building an interstate highway system was vital, and expressed that “Together, the united