All Posts
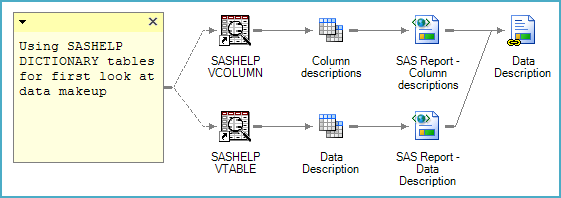

This isn't the first blog post to laud the "Note" feature of SAS Enterprise Guide. You know, the feature that allows you to add documentation to describe what the heck your project or process flow is actually doing. For example, Tricia described 3 useful ways to use the note feature.


Acronyms are funny things. Need an example? Try decoding this sentence: How is event stream processing (ESP), applied to electrical submersible pumps (ESP) in the oil and gas industry, like extrasensory perception (ESP)? Even if you had extrasensory perception you would still need some clarification if that sentence contained acronyms only.


SAS Enterprise Guide and SAS Global Forum -- two of my favorite things! And I get to talk about both of them in this post. I'm a devoted SAS Enterprise Guide user, and I hope you're learning how useful this tool can be as well. On February 13, I'll be sharing
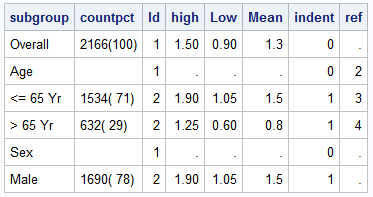

Most simple graphs generally include graphical representation of data using various plot type such as bar charts, scatter plots, histograms, box plots step plots and more. Both SG procedures and GTL provide many easy ways to create such graphs. However, for many real world use cases, we need to display related textual data in


Interest in "data" is at an all-time high. The popularity of search terms like "big data," "Hadoop" and the "Internet of Things" spiked dramatically in the past year. The fact is, organizations are more interested in the potential of big data platforms and data management solutions than ever before. That’s
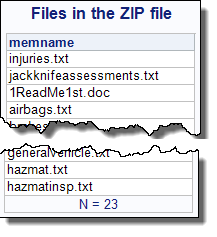
Need to read or update a ZIP file within your SAS program? In SAS 9.4, you can use the FILENAME ZIP access method to do the job. Explanation and examples here!


Does your site have multiple people maintaining a single deployment of SAS? Is it important for them to maintain a clear audit trail of who is doing what exactly? Or do you need to update your SAS deployment using different userids? Let's take a look at some techniques to manage


This year the Super Bowl will take place in East Rutherford, New Jersey at MetLife Stadium just outside New York City. For the first time in this event’s 48-year history, the game will take place outdoors in a cold-weather environment, potentially subjecting players and fans to sub-freezing temperatures. The fans


As I embark on 2014, I reflect upon the many competing, yet interdependent, tensions discussed in education circles in 2013. In conferences, classrooms and statehouses, adults who care about kids debated the best ways to implement: New academic standards (Common Core State Standards or other College and Career Ready Standards)
Users have often expressed the need for more marker symbols. ODS Graphics supports over 30 scalable marker symbols, both filled and empty. As mentioned in an earlier article, with SAS 9.4, filled markers can now have outlines and fills, and can also have special effects. Also with SAS 9.4, now you
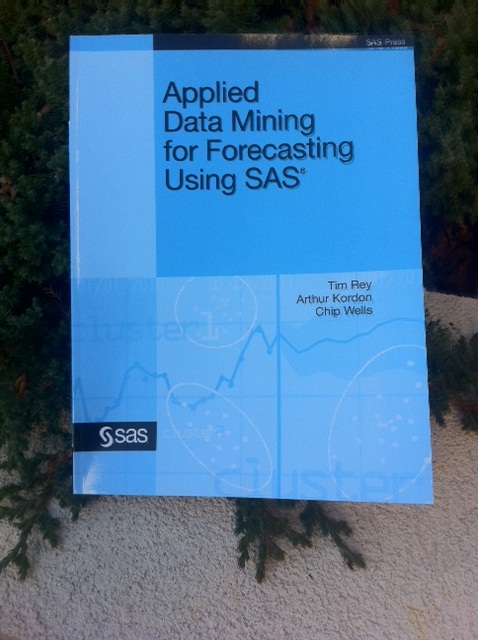

This week's SAS tip is from Applied Data Mining for Forecasting Using SAS by Tim Rey, Arthur Kordon, and Chip Wells. Whether you're a forecasting practitioner, engineer, statistician, or economist, you'll appreciate the many real-world examples in the book. And hopefully this free excerpt. The following excerpt is from SAS Press


Performance management systems are becoming more important to local governments across the country. This is true for several reasons. Citizens are calling for a more accurate accounting of how their tax monies are being spent. Local government revenues have not been growing as much as in the past and, in
I remember exactly where I was when I heard that Marje Fecht was selected as the conference chair for SAS Global Forum 2014. This was April 2011, and I was at PURE Nightclub in Las Vegas. That's not my usual "clubbing" scene, but we were at the kickback party for

Even though I’ve worked as software technology marketer over the years, I have to admit that on a personal level I’ve probably related more to TV programming than software programming. When it comes to writing, I’ve always gravitated more toward crafting marketing communications than code. And when it comes to


In a previous post, I showed you how to send graphs with charttips & drilldowns in an email ... but what if you also need to send the graphs that you're drilling-down to? You guessed it - SAS also has a slick trick for doing that! When you create SAS graphs