All Posts

This post could be titled something like "Everything you wanted to know about Group Order in GTL - and more." The group ordering shows up in three different ways in your graph. Assignment of attributes (color, marker symbol) to group values. Position of group values in the graph. Display of the group


Although I’m not particularly excited about football (I admit, I don’t completely understand what offside means), I did follow the last World Cup with more than average attention. Not only for the handsome players, but especially for all the fascinating statistics that appeared. It struck me that heat maps popped


I’ve been told I have rocks for brains before, but right now I have rocks on the brain – the kind that are millions of years old and contain precious stores of oil and gas. One reason I have petroleum on my mind is that I’ve just returned from Brazil, where

Do you know the way to San Jose? By now, SAS users are getting to know the way to the Western Users of SAS Software’s (WUSS) annual event on September 3-5, 2014. Although this is the third time WUSS has been held in San Jose at The Fairmont Hotel, this
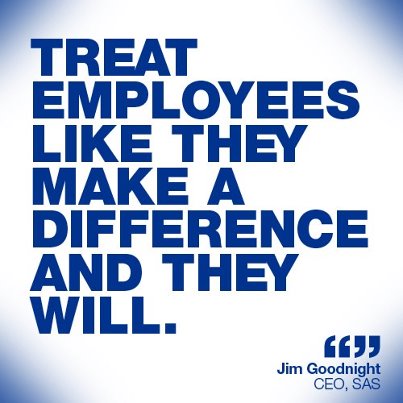

For 38 years, SAS CEO Jim Goodnight has run this company by a simple philosophy: Treat employees like they make a difference and they will. It was with that philosophy in mind 30 years ago that SAS opened the doors to its on-site healthcare center – with just one employee!


If you recognize this 1984 Wham! hit then you also recall girls in ties and blazers, guys in leisure suits, gas for $1.10 a gallon and seeing The Karate Kid at the Cineplex for $2.50 (at night!). If you think music and fashion were suspect thirty years ago, consider SAS’


SAS is great at helping make important business decisions - how about helping decide where to take your next vacation?... Here's a picture from one of my favorite vacations with my buddy Joe. As you can see, I like "nature vacations." Can you guess where this one was? (leave a comment with

What is your primary goal as a supply chain professional? It’s not about demand sensing, demand shaping or even supply planning and demand planning. At the end of the day, it’s about profit optimization. Albeit important, demand sensing and shaping are only a piece of the equation and if isolated, decisions
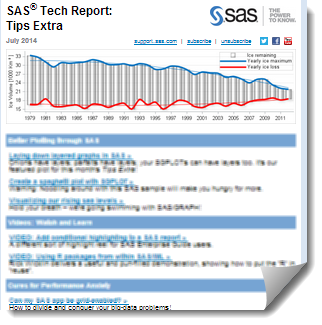

When it comes to e-mail-based newsletters, I'm of two minds. On one hand, I feel like I receive enough (or maybe too much) e-mail and I'm reluctant to clog up my inbox with more stuff -- especially if it's information that's located elsewhere (such as on that big backup drive
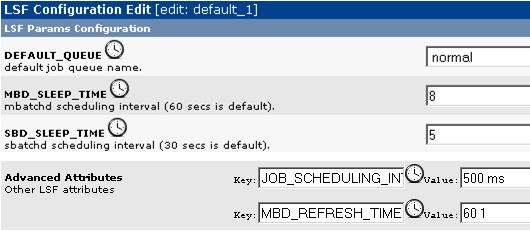

Most organizations enjoy a plethora of SAS user types—batch programmers and interactive users, power users and casual—and all variations in between. Each type of SAS user has its own needs and expectations, and it’s important that your SAS Grid Manager environment meets all their needs. One common solution to this


I love summer. I love the sunny days, the sound of the happy birds in the morning, growing tomatoes in my back yard, and playing outside with my family. Beach or mountains – I’m 100% beach. Sunshine or snow? 100% sunshine, palm trees, sand, and the beautiful sound of waves


While managing quality within the four walls of your own operation is all well and good and totally necessary, both the market and your bottom line are demanding a more holistic, quality lifecycle approach, and in support of that aim there is a treasure trove of downstream data waiting to be


Have you written a SAS/IML program that you think is particularly clever? Are you the proud author of SAS/IML functions that extend the functionality of SAS software? You've worked hard to develop, debug, and test your program, so why not share it with others? There is now a location for


This was probably my favorite of the myth-busters webcasts I have been spewing about, and now I definitely want to meet James Dallas so we can discuss and nod emphatically at each other’s insights on this topic! The “You can’t have analytics without IT” myth is the fourth myth covered


A recent project with a supportive housing provider in New York City showed how analytics leads to insights that can change, even save, lives. The New York City Center for Innovation through Data Intelligence (CIDI) is the analytics research arm of the City’s Deputy Mayor for Health and Human Services