All Posts

Well, this is a kick to the giblets. I assumed when I was summoned to the White House it was in recognition of my tireless advocacy for turkey rights. I wasn’t expecting a press conference in the rose garden or anything, just a meet and greet with the prez and


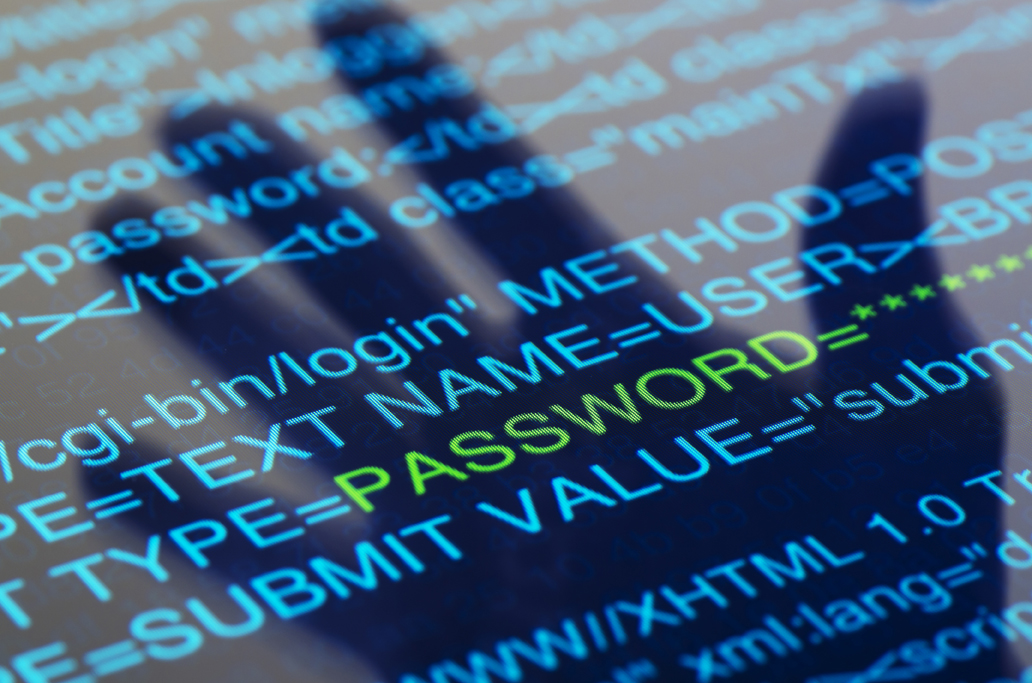
Not all fraud originates from the dark underground of criminal enterprises. In fact, fraud could literally be right under our noses, or in the cubicle next to us. The “Insider Threat” has many names – internal fraud, occupational fraud, even espionage – and uses authorized internal access and knowledge to

Every day there are news stories of fraud perpetrated against federal government programs. Topping the list are Medicaid and Medicare schemes which costs taxpayers an estimated $100 billion a year. Fraud also is rampant in other important federal programs, including unemployment and disability benefits, health care, food stamps, tax collection,

Many managers still perceive data quality projects to be a technical endeavour. Data being the domain of IT and therefore an initiative that can be mapped out on a traditional project plan with well-defined exit criteria and a clear statement of requirements. I used to believe this myth too. Coming


Arrays are a powerful SAS programming tool. They can be used to simplify coding for repetitive calculations, to transpose data and to evaluate variables in a non-sequential manner. Sometimes users are intimidated by the term array, but in SAS, an array is simply a grouping of variables that lasts for

Hadoop recently turned eight years old, but it was only 3-4 years ago that Hadoop really started gaining traction. It had many of us “older” BI/DW folks scratching our heads wondering what Hadoop was up to and if our tried-and-true enterprise data warehouse (EDW) ecosystems were in jeopardy. You didn't

When it comes to fraud detection and risk mitigation, predictive modeling has earned a reputation as the “heavy hitter” in the realm of data analytics. As our celebration of International Fraud Awareness Week continues, I would challenge our readers to ask themselves this question, “Is the reliance upon predictive analytics

Today’s healthcare system is under tremendous pressure to reduce overall costs without losing track of the patient. Legislative changes and challenging economic realities make it increasingly difficult to deliver both improved outcomes and cost savings for the most complex patients. The Physicians Pharmacy Alliance (PPA) recognizes the changing healthcare landscape

During a migration to a new release of SAS software, the SAS Migration Utility is used to analyze and package your source software. There are two ways that you can get the SAS Migration Utility. It’s available by selecting SAS Migration Utility from the Downloads page on support.sas.com. The SAS Migration


When I think of Cream of Something Soups, I immediately envision iconic 1950s ads of creamy casseroles made by happy, smiling home cooks in aprons and pearls. My second thought then quickly turns to: what are those cream of...something or other...soups really made of?! The answer: WATER, MUSHROOMS, VEGETABLE OIL
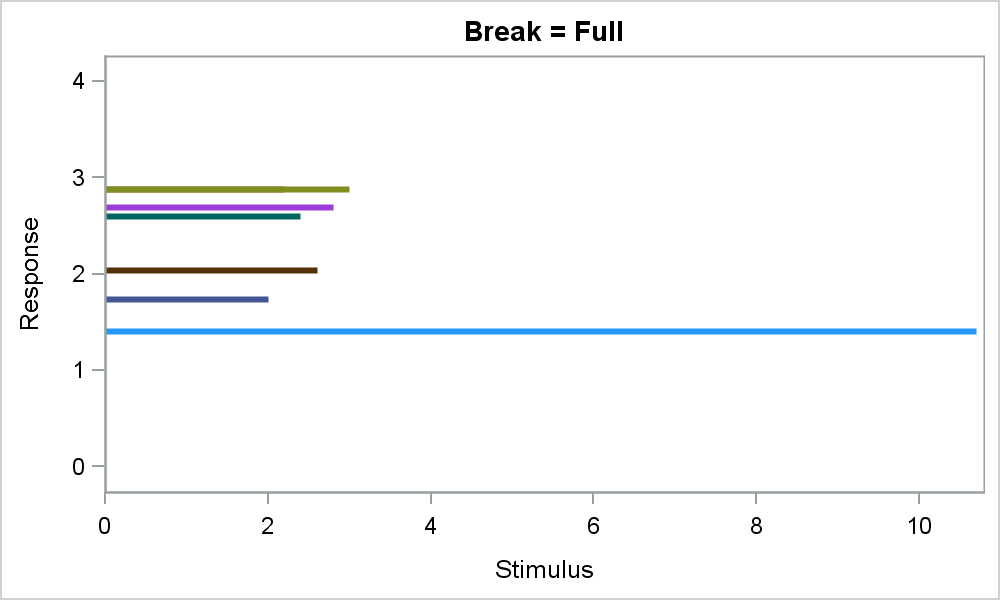

Often, we have data where most of the observations are clustered within a narrow range, with a few outliers positioned far away. When all the data is plotted, the axis is scaled to accommodate all the data, thus skewing the scale. Techniques to handle such data have been addressed earlier
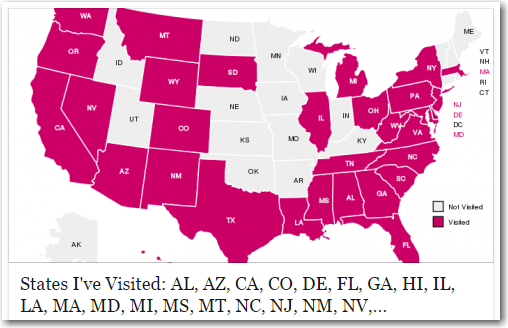

There's recently been a "States I've Visited" application going around on Facebook, where users create a map showing all the US states they've visited, and then post it on their page for their friends to see. I wondered if SAS could do a better job?... Here's a screen-capture of one

On a cold and wet December morning in 2008, at approximately 1:30 AM, I pulled into the parking lot of an abandoned supermarket in Arlington, TX. With sleet pelleting my windshield, I saw three additional sets of headlights enter into the parking lot from different directions. All three cars converged

Many vendors claim they have analytics, and a lot of users have embraced the belief that analytics is the way to go. But what does analytics really mean, especially to business users without statistics backgrounds, and how much do they need to know about analytics to be able to make


All of us are familiar with common fraud types. Insurance fraud, credit card fraud, identity theft, and tax evasion are among the most recognized areas. But, there are many other fraud types that have a big impact on our daily lives, yet receive little attention in the media and among