All Posts


SAS Global Forum では、毎年SASの全てのキーマンが集結します。もちろん2015も例外ではありませんでした。2014年にスマートメーター活用セミナーの講師として来日もした、グローバルセールス&開発マネージメント ビジネスディレクターのTim Fairchildおよび、エネルギーソリューション担当プロダクトマーケティングマネージャーのAlyssa Farrellと短い朝食ミーティングで意見交換をしてきました。日本では電力小売り自由化もありアナリティクスの活用が進んでいますが、世界的に見てもエネルギー業界にアナリティクスの大きな潮流がやってきています。 それを表すかのように、SAS Global Forum 2015において非常に多くのユーティリティ業界に関するプレゼンテーションがありました。それをご紹介します。 生存時間分析を使用した変圧器の寿命予測とSAS Enterprise Minerを使用した過負荷状態で変圧器を使用している際のリスクモデリング(Predicting transformer lifetime using survival analysis and modeling risk associated with overloaded transformers Using SAS® Enterprise MinerTM 12.1) 「いつ変圧器が故障するのか?」 これが米国のユーティリティ企業が毎日頭を悩ませている問題である。ユーティリティ企業のインフラで最も重要なものの一つが変圧器である。コストを削減し計画的にメンテナンスし、故障による損失を低減するためには、この変圧器の寿命を把握することが重要である。そしてもう一つ重要なことは、過負荷による突発的なパフォーマンスダウンを避けるために高リスクな変圧器を事前に特定しメンテナンスすることである。この論文の目的は、SASを使用して変圧器の寿命を予測し、それらの故障に繋がる様々な要因を特定し、メンテナンスを効率的に行うために変圧器を、負荷状態に基づいて、高リスク、中リスクそして小リスクといったカテゴリに分類するモデルを作成することである。この研究で使用したデータは、米国のユーティリティ企業のものであり、2006年から2013年までのデータである。このデータに対して生存時間分析を行った。Cox回帰分析(比例ハザードモデル)を使用して、変圧器の故障の要因を特定した。また負荷に応じたリスクカテゴリを作成するために、いくつかのリスクベースモデルを使用した。(続きはこちら) 顧客クラスタリングにおけるイノベーティブな方法(An Innovative Method of Customer Clustering) この論文は、SASを使用して顧客セグメントを作成する新しい方法について紹介する。著者はある巨大なユーティリティ企業が提供している9つのプログラムに登録している顧客を調査した。これらにプログラムとは、請求の平準化、支払方法、再生可能エネルギー、効率化、機器の保護、使用量レポートなどである。640,788の家庭のうち、374,441のデータが利用可能であった。これら約半数(49.8%)の分析対象顧客はいくつかのタイプのプログラムに属しており、顧客の特徴を通してこれらプログラムの間の共通性を見出すためには、多くの場合、クラスター分析と相関マトリックスが利用される。しかし、所属しているか否かという二値という性質により、これらの手法の価値はかなり限定的になる。それだけでなく、各プログラムは相互に排他的であることもその一因となる。これらの制限を乗り越えるために、各顧客がどのプログラムに属するかの予測スコアを算出するために、PROC LOGISTICを使用した。(続きはこちら) ブラジルの電力部門における電力損失の査察のためのターゲット選定の改善のためのモデリング-CEMIGの事例(Modeling to improve the customer unit target selection for inspections of


The smart grid is a technology infrastructure that adds intelligent capabilities to the electricity distribution system. When you apply analytics to the smart grid data, you can automate and improve operations, maintenance, planning and customer satisfaction - among other processes. As utilities continue to upgrade meters, transformers, and add new sensors and equipment,


Bald eagles, the national bird of the United States, came perilously close to becoming extinct here, but are now making a comeback! Let's look at the data with a SAS map! When I was growing up in the 1970s & 80s here in North Carolina, I spent a lot of time

One of the great things that the new Data Mart will do for you is combine data from all the machines found in a multi-machine deployment into one storage area, where it is used to create many of the reports found in the Report Center. This capability began with the 14w41

.@philsimon on whether companies should apply some radical tactics to DG.


The insurance industry is heading for a crisis. Depending on which report you read the insurance industry is facing a shortfall in job vacancy from anything from 40,000 to nearly half million in the next few years. Baby boomers in specialized jobs like underwriters and claims adjusters are retiring and insurers
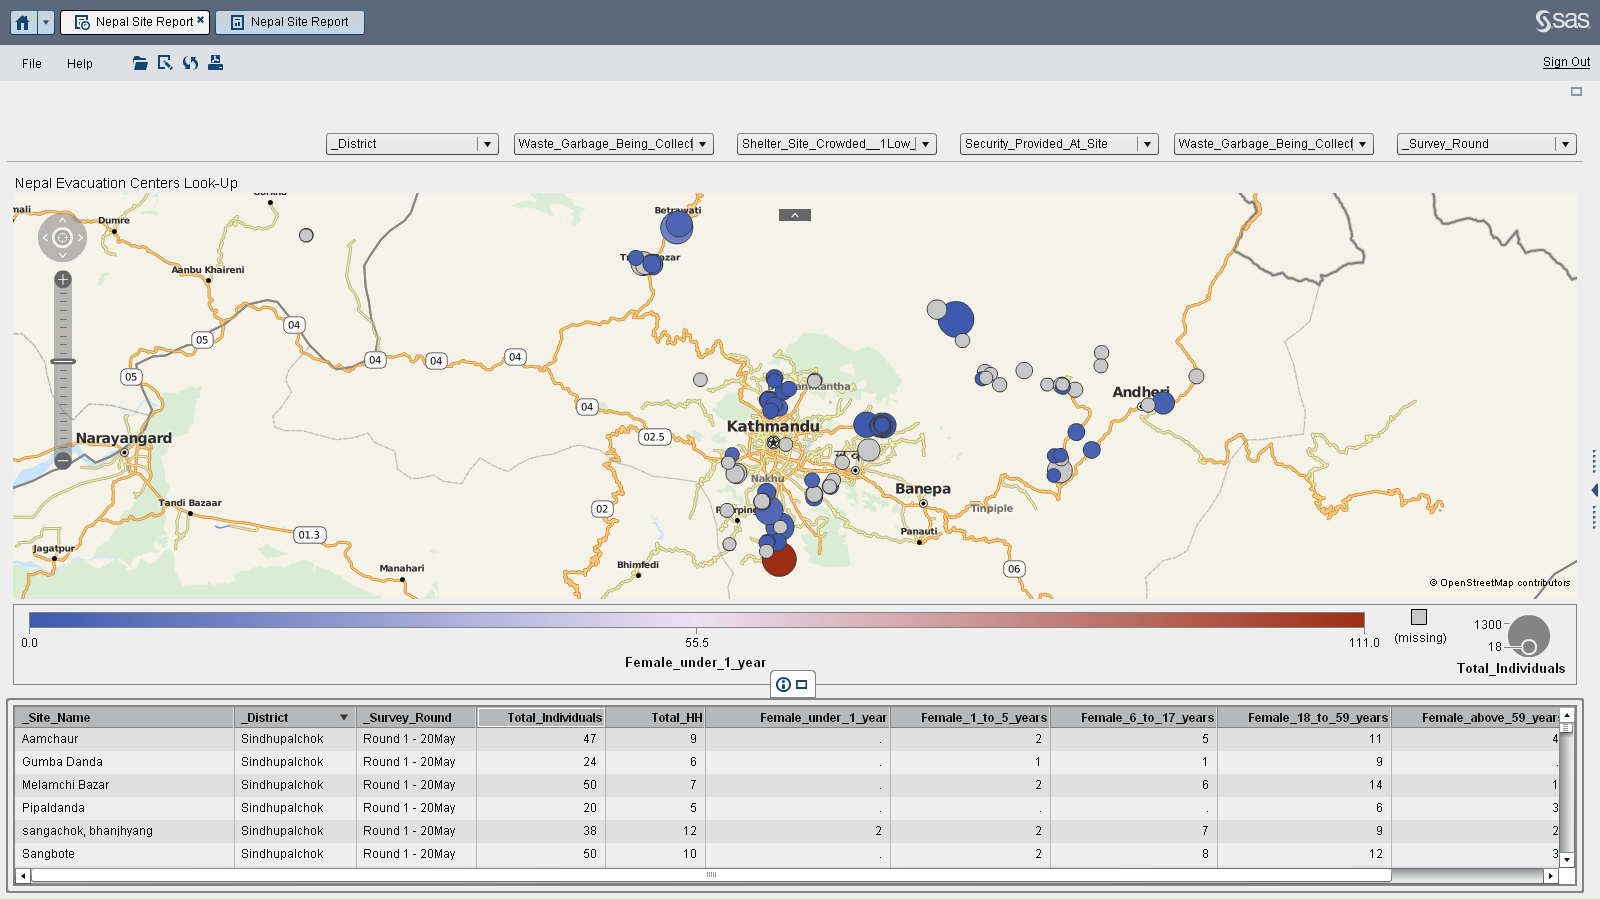

As monsoon season begins, many Nepal earthquake victims have shelter over their heads thanks in part to an unlikely intersection of two SAS global development projects. The first project is with the International Organization for Migration (IOM). IOM is the first responder to any crisis that displaces people. IOM provides
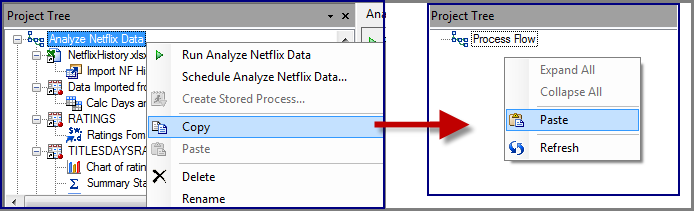

I've seen some crazy process flows in SAS Enterprise Guide. Crazy-big, and crazy-complex, used by real customers to accomplish real work. But while these process flows represent a ton of work, this is usually a calculated investment to automate processes that would be difficult to capture in another way. For


I just spent much of the past week watching and trying to ride waves on the North Carolina coast. Small waves, mind you, nothing spectacular and certainly nothing that you would consider edgy or life-altering. Nothing that big wave surfers like Laird Hamilton, Garrett McNamara and others of their substance


We’ve all heard that dark leafy greens are good for us. Did you know that dark green leafy vegetables, calorie for calorie, are considered one of the most nutrient-dense foods available!


This is my second blog on the topic of anonymization, which I’ve spent some time over the past several months researching. My first blog, Anonymization for data managers, focused on the technical process. Now let’s dive into the role for analysts, report designers and information owners. To analysts and reporting

As you travel around the world, do you know where English, French, Spanish, and Arabic are spoken? This blog will help you quickly answer that question, with some cool SAS maps! But first, here's a picture of my friend Joy posing beside an interesting sign during one of her international

Yes. But since this post needs to be more than a one-word answer to its title, allow me to elaborate. Data governance (DG) enters into the discussion of all enterprise information initiatives. Whether or not DG should be the opening salvo of these discussions is akin to asking whether the

What does the future of analytics look like in your organizations enterprise architecture? Does it include thinking about a two speed approach to analytics which includes both: An agile rapidly changing analytics platform for innovation (a lab) seperated from operations and broad enterprise audience usage A slowly moving systematic enterprise analytics platform (a factory)
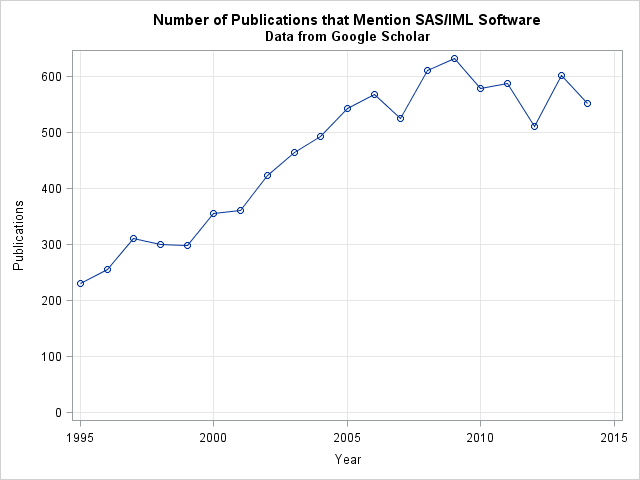

SAS/IML software is used by many SAS programmers, primarily for creating custom algorithms and macros that implement statistical analyses that are not built into any SAS procedure. I know that PROC IML is used regularly by pharmaceutical companies, by the financial and insurance industries, and by researchers in medical colleges