All Posts

I started out as a Psychology major. During my third year as an undergraduate, I was hired on as a research assistant for my advisor in her cognitive psychology lab. Through this and progressively more complicated psychological research experience, I quickly grew to love statistics. By the end of that


Desde la aparición de la banca electrónica, ya hace varios años, las empresas y las personas se han visto favorecidos en gran medida, dado que ofrece grandes beneficios para ambos sectores de consumo. Sin embargo, ahora nos enfocaremos en analizar dos de las principales soluciones que este tipo de servicios

Data science may be a difficult term to define, but data scientists are definitely in great demand! Wayne Thompson, Senior Product Manager at SAS, defines data science as a broad field that entails applying domain knowledge and machine learning to extract insights from complex and often dark data. To further


When shopping for a new TV, with many sets next to each other across a store wall, it is easy to compare the picture quality and brightness. What is not immediately evident and expected is the difference between how the set looked in the store and how it looks in your


As I've previously written, data analytics historically analyzed data after it stopped moving and was stored, often in a data warehouse. But in the era of big data, data needs to be continuously analyzed while it’s still in motion – that is, while it’s streaming. This allows for capturing the real-time value of data
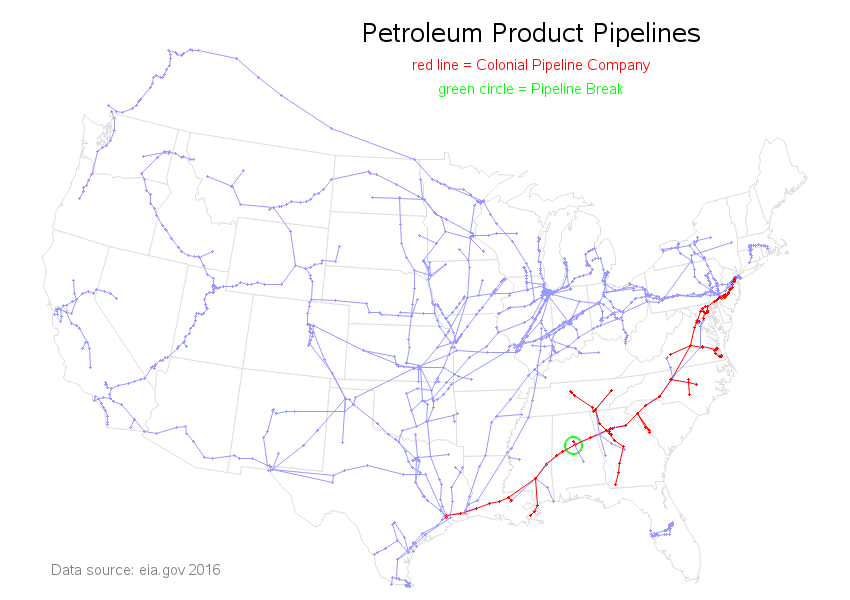

Last week, one of the major pipelines supplying gasoline to the eastern US broke. Do you know where the break is, and which states will be having shortages? Me neither! ... So, of course, I created a SAS map to help... First I read up about the spill on various


Wheat rust. You may have never heard of it, but in a matter of days, this fast-moving, silent-killing plant disease can completely annihilate a critical wheat farm in Ethiopia. Wheat rust’s newest nemeses? A legion of volunteer superheroes in the Data for Good movement. When Jake Porway, Founder and Executive


Analytics Experience 2016 featured more than 100 breakout sessions and talks covering numerous topics in big data. You can watch many of those talks from our Analytics Experience 2016 video portal, where select keynote and session talks are archived. To give you a taste of the content you'll find there, here’s a
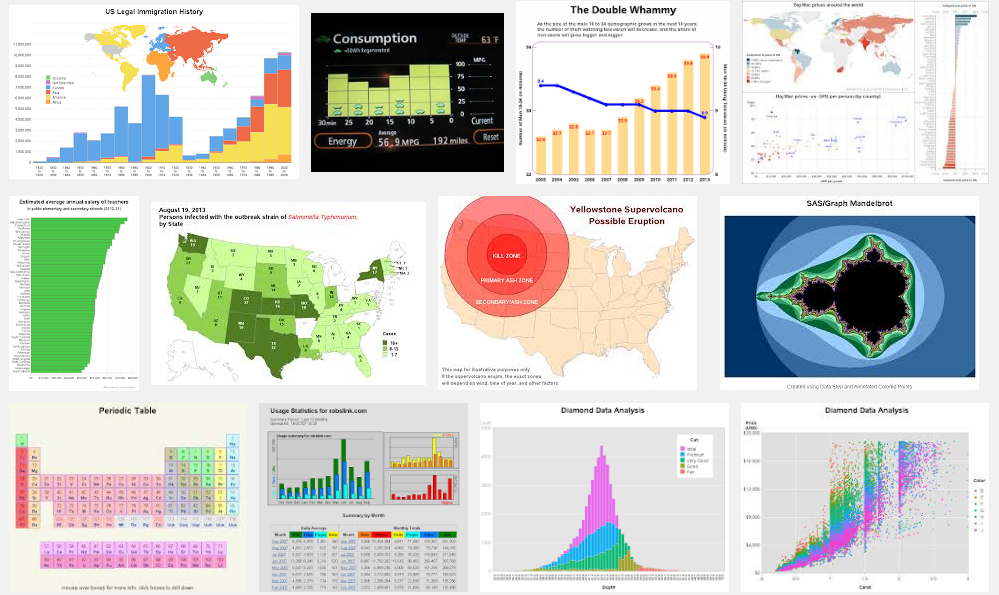
I've created several hundred SAS graphs over the years. I was just musing to myself this morning how nicely Google lets me peruse through images of my graphs. And I thought some of you might also like to know how to do that... Most of you know how to search for keywords


If you use SAS® software to create a report that contains multiple graphs, you know that each graph appears on a separate page by default. But now you want to really impress your audience by putting multiple graphs on a page. Keep reading because this blog post describes how to


.@philsimon on the need to adopt agile methodologies for data prep and analytics.
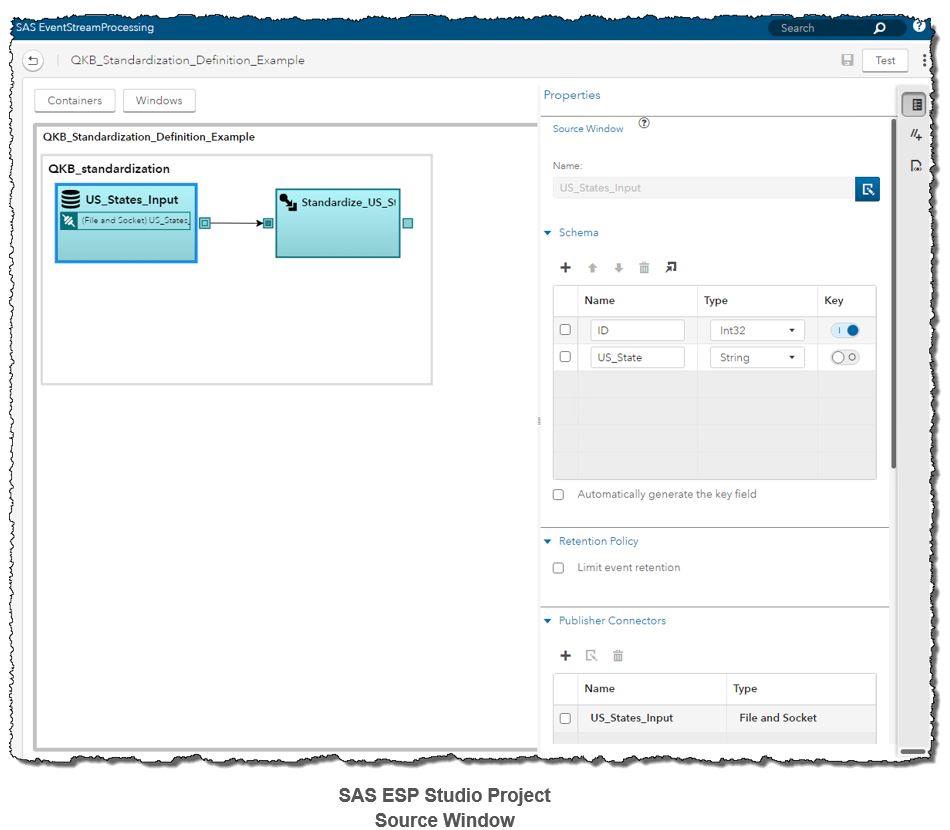

The SAS Quality Knowledge Base (QKB) is a collection of files which store data and logic that define data cleansing operations such as parsing, standardization, and generating match codes to facilitate fuzzy matching. Various SAS software products reference the QKB when performing data quality operations on your data. One of

Historically, generations could expect to experience one – maybe at best – major technology disruption or transformation in their lifetime. That’s simply not the case today. Today it is more difficult than ever before to know what will transform the technology landscape in the next month or the next year.


I’m a productivity junkie! Living in a culture where productivity is highly valued, cutting corners on sleep is often a life survival skill. We’ve been trained to function this way (at least in the US) for over 50 years. As a result, being tired and fatigued is the status quo


A pesar de que el Big Data, la Analítica y los científicos de datos ahora están en todas partes, estos temas les pueden parecer completamente desconocidos a muchos de los colombianos. La primera define el desbordado crecimiento que están teniendo los datos a nivel mundial (cada vez que envía un