All Posts


*Este articulo surge de la motivación que generó un taller para periodistas de Latinoamérica, cuyo tema central fue hablar de la Infodemia y principalmente responder a la pregunta ¿Cómo interpretar los datos de una pandemia? Dada la coyuntura de la pandemia que ha afectado a todos los países y


La gran velocidad con la que se propagó el COVID-19 a lo largo del primer trimestre del año provocó cambios radicales en el comportamiento y hábitos de los consumidores: hoy se enfocan principalmente en satisfacer sus necesidades más apremiantes, dejando en segundo plano la adquisición de productos o servicios que


Ever thought you could help save the rainforest without ever visiting the rainforest? Probably not, but now is your chance, and you can use it as your way to give back this Earth Day. This year, Earth Day celebrations will look different for everyone as we work to find meaningful
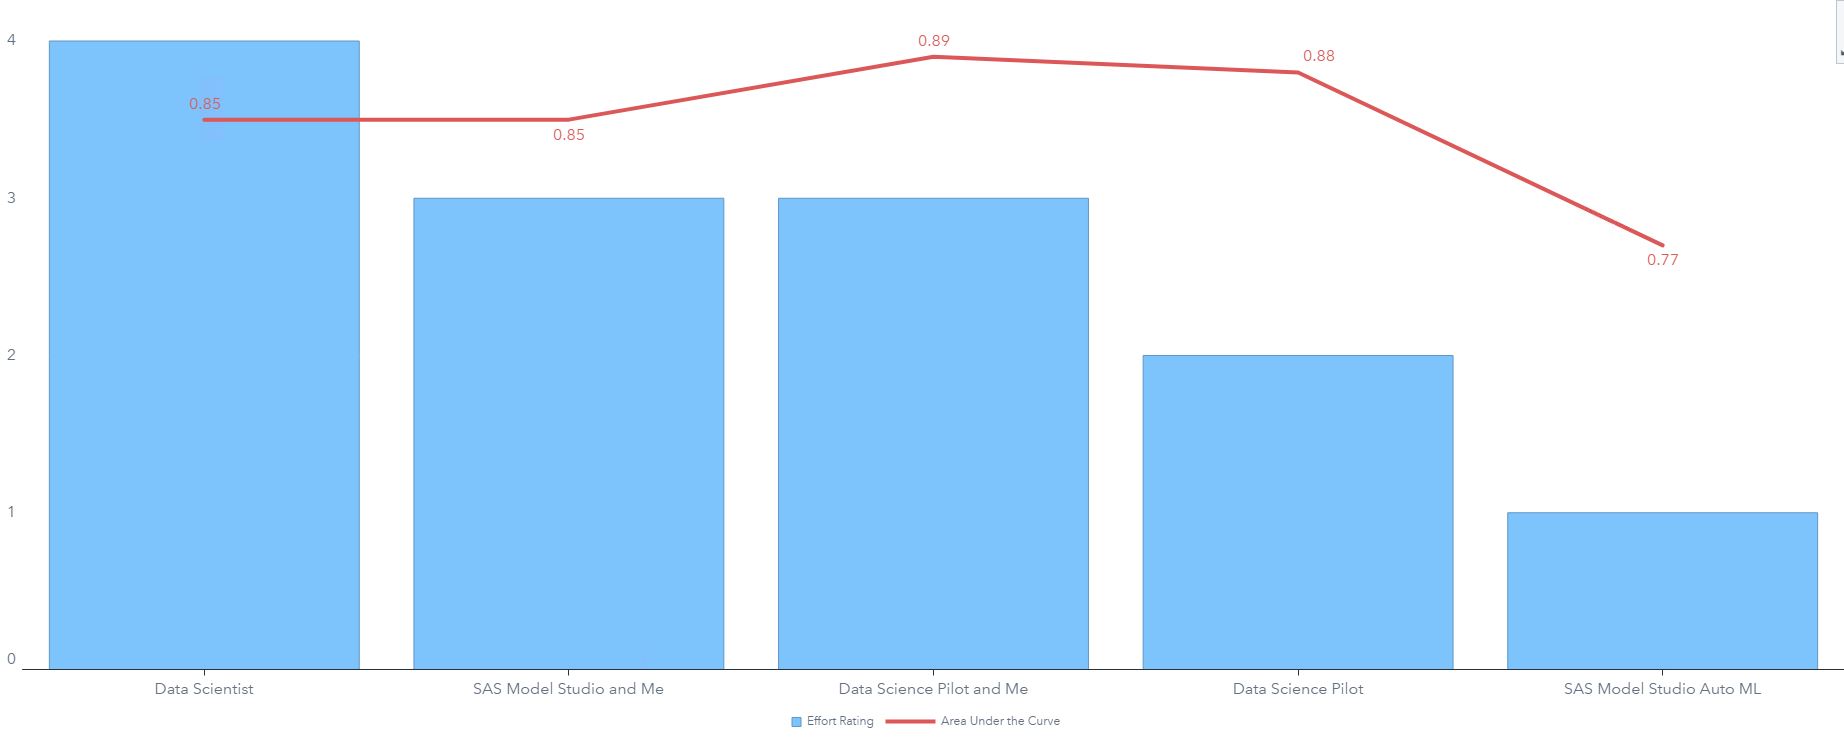

Ever since automated machine learning has entered the scene, people are asking, "Will automated machine learning replace data scientists?"


Written by Allison Hines and Kara Roberts Here at SAS, our culture revolves around our people. Our endless curiosity and innovative spirit help us solve our customers’ most challenging problems – but our employees’ impact is even bigger than that. There’s strength in numbers, and during this difficult time, our employees’ generosity and creative problem-solving are helping those who need it most around the world. From providing laptops to students in need,


Today, many assets across multiple industries are becoming more instrumented and connected to enterprise platforms to provide additional insight into their health and operation. IDC estimates that Internet of Things (IoT) investment will reach $1.12 trillion in 2023. One important area for many industrial organizations that are focused in using


We've set up a Covid-19 task force to support you during this crisis. We offer free consultations and can provide recommendations.
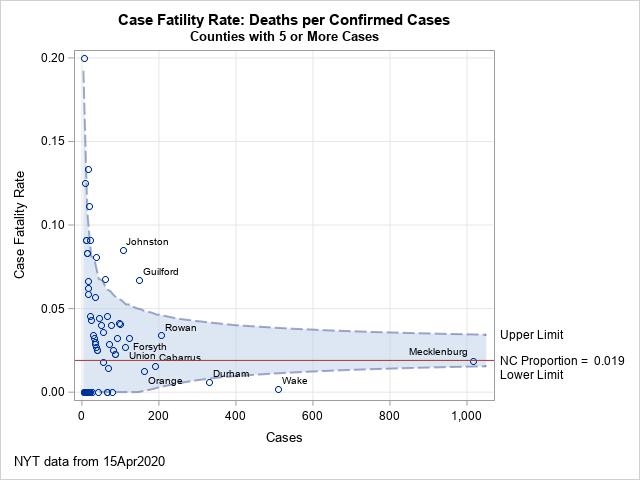

Death is always a difficult topic to discuss, and death has been in the news a lot during this tragic coronavirus pandemic. Many news stories focus on states, counties, or cities that have the most cases or the most deaths. A related statistic is the case fatality rate, which is


Antes de marzo, los líderes de las empresas vivíamos nuestra vida más o menos normal, yendo a las oficinas y tratando de hacer nuestras labores lo mejor posible, aunque ya atentos a lo que podría ocurrir con el COVID-19, a las medidas que los gobiernos tomarían y a las alteraciones


Sleep is the ultimate way to recover and it now has well-deserved research showing its importance to health and longevity. Discover 16 tips that will assist you in getting quality sleep. 1. Recognize the Importance of Sleep - We all know how we feel when we are sleep deprived. The consequences


Let's talk about using DLPy to model employee retention through a survival analysis model. Survival analysis is used to model time-to-event. Examples of time-to-event include the time until an employee leaves a company, the time until a disease goes into remission, or the time until a mechanical part fails. The


With stay-at-home orders in place, parents around the world are balancing quality family time with working remotely. Many children are engaged in online learning activities and other parents are trying to find meaningful experiences for their kids while they’re away from traditional learning environments. It can be an overwhelming task

商品やサービスを販売している企業においては、過剰在庫を防止したり、欠品による機会損失を防止し、収益を最大化するために需要予測が行われています。しかし、実際のビジネスの現場では、需要や売れ行きの傾向が異なる品目が混在するようなケースでは、その予測に多くの手間と時間がかかってしまうなどのいくつかの課題があります。 例えば、通年売れる品目や動きが遅い品目、新規品目、季節に影響を受ける品目などがあり、これらは同じ時系列モデルで処理できるわけではありません。このような課題に対する一つの解決策としては、パターンの近い商品をサブセグメントに小分けし、そのセグメントに応じて予測戦略を適用しわけることで、精度を向上します。つまり、時系列データの特徴を自動に分析して需要のパターンごとにデータを分類し、需要パターンごとに予測作業をすることです。この需要パターンの自動分類と予測については、すでにブログでご紹介しているので、こちら「SAS Viya: ビジュアルパイプラインで需要分類&予測」を参照してください。 一方で、単に時系列データとしての特徴だけではなく、品目の種類や販売地域など、業務的な観点での品目属性によって予測を管理したり、または、属性情報を加えて特徴エンジニアリングし、その特徴量と属性を加味することで精度向上を期待することもあります。そうすると、さらに自由に複雑な属性を持つ大量な時系列データを小分けして精度の高い予測結果が期待できます。つまり、ビジネス的な品目属性に基づいてデータを分割し、業務システムから属性ごとの品目データを抽出、加工処理し、それぞれ別々にモデリングを行うケースです。予測結果の全体像を把握するためには、個別に予測を実施した後、それらの結果を収集し、統合する必要もあります。 しかし、このような、データの分割や再集約には多くの手間がかかりますし、データを管理するための命名ルールなども慎重に行う必要があります。こうした課題を解決し、需要傾向の異なる商品が混在する大量のデータに対して、一つのモデリングプロジェクで最適な需要予測を一括で行うことができたら、便利だと思いませんか? 今回は、このような実際の背景にもとづき、こうした複雑な分析処理を一元的に、手軽に実現できるSAS Visual Forecastingのセグメンテーション予測機能を紹介させていただきます。 SAS Visual Forecastingの機能を活用することで、時系列データを、データの性質(動きが遅い品目、新規品目、季節品目など)に基づき、複数の類似する時系列セグメントに分割することができます。その上で、予測プロジェクト内で各セグメントを個別にモデル化できます。これにより、ユーザーは各セグメントにおける時系列のパターン/特性をより的確にモデル化するためのモデリング戦略の調整を行えるようになりますし、予測結果を全体的に把握することも可能になります。 それでは、一つの具体例を見ながら、Visual Forecastingのセグメンテーションの有用性を実感していきましょう。 今回は、米国でスキンケア商品の販売を手掛ける企業における、需要予測の課題を解決することを想定しています。この企業は、スキンケア商品の時系列売上データに基づき商品セグメントごとに二週間先の売上高を予め把握(予測)しておきたいと考えていました。 まずはスキンケア商品の時系列データを見てみましょう: 上図のように、毎日各倉庫から在庫の各商品を発送して売上高を計上、また店から各商品に行われたプロモーションやキャンペーンなどの情報を収集し、商品時系列データにまとめます。今回は、各倉庫の管理している商品売上高に基づき予測を行います。 上記の情報を表にすると下記の時系列データになります。 商品は「ProductKey」、販売倉庫は「DistributionCenter」、販売時間の時系列データは「DATE」、販売に影響する変数として割引率の「Discount」。最後に、予測目標の売上高は「Revenue」になります。 この販売トランザクション情報に、商品マスターの属性情報を加味します。 商品マスターの属性情報というのは、上図のような販売チャンネルや商品カテゴリーなどの商品が販売プロセスにおける各種補足情報のことです。例えば、販売量の高い商品はどの販売チャンネルから売れたか、どの商品カテゴリーのものか、これらの情報は商品の販売曲線の可視化にも使えるし、精確な予測にも不可欠であり、将来の販売推進方針にも繋げます。 一つの具体属性データサンプルを見ます。 商品のカテゴリーが「ProductCategory」、商品名は「ProductName」、商品の販売チャンネルが「ProductType」です。そして、商品セグメントが「_seg_」になります。セグメントという項目を少し紹介します。例えば、小売業界にとって通年売れる商品や季節限定の商品などが必ず存在すると思います。しかし、小売業者にとって、具体的に自社商品の中でどのようなものが通年売れる商品なのか、どのようなものが特別な時間にしか売れないのか、その商品を担当する担当者しか把握きません。長年にわたり、商品ごとに「通年売れる商品」や「夏限定商品」、「クリスマス商品」、「新規開発の商品」などの特徴を明白なビジネスノウハウにし、需要予測にも使いたいと考えています。このような情報を商品セグメントと称し、セグメントごと明らかに時系列特徴もはっきり分かれています。 最後に、下図のように、時系列データと属性データを結合させ、予測モデルに利用するマスターデータの準備が完成です。 今回はSAS Visual Forecastingを活用することで、時系列データを、データのセグメント属性(通年販売品目、新規品目、季節品目など)に基づき、複数の類似する時系列セグメントに分割し、精確な予測を実現することを目的としています。それを実現するため、本来であれば、各商品セグメントのマスターデータをそれぞれ抽出してモデル開発と予測を実施する必要があります。例えば、通年売れる商品に関しては従来通りにARIMAモデルで予測し、一方で、新たに開発し、販売後間もない新規開発の商品に関してはニューラルネットワークでのモデリングを適用したい場合があります。しかし、現在商品セグメントが多数もあり、データの前準備にも手間がかかります。 SAS Visual Forecastingのセグメンテーション予測機能を利用すれば、データの分割をせずすべての商品カテゴリーのデータを含むマスターデータで簡潔かつ精確にモデリングを行えます。 ここまでは今回のセグメンテーション予測イメージの説明になります。これからは実際にSAS Visual Forecastingで操作する様子を体験していきます。 まずは、Visual Forecastingのプロジェクトを一つ立ち上げます。プロジェクト名をセグメンテーション予測にして、テンプレートに外部セグメンテーションを選びます。データは先ほど説明したスキンケア商品の時系列データ「SKINPRODUCT」を選択します。 次はプロジェクトデータ設定画面で、予測用の時系列データの各列に役割を指定します。 例えば、以下のように役割を割り当てます 「時間」:「DATE」列(日付) 「独立変数」:「Discount」(値引額) 「従属変数」(ターゲット変数):「Revenue」(売上高) By変数というのは、時系列データをグループにまとめる単位を指しています。 そしてデータソースとして時系列データの属性情報を持っているマスター表「SKINPRODUCT_ATT_SEG」も追加します。この表を追加したことによって、さらに細かいグループベースで予測することができます。 この表には予めセグメンテーシ予測用に作成しておいた「_seg_」列が含まれます。中身は商品セグメント名で、計7セグメントが入っています。例えば、「Long term - All year goods」(通年販売商品)、「Long


Welcome to the first post for the Getting Started with Python Integration to SAS Viya series! With the popularity of the Python programming language for data analysis and SAS Viya's ability to integrate with Python, I thought, why not create tutorials for users integrating the two? To begin the series


Breathe! Move! Breathe! Move! I vividly remember doing sit ups under a blistering sun until one more person quit or threw up. Dripping under the NC sun, I focused on my kneecaps as I moved. Coach Buddha paced by and barked “Don’t quit on me!” I, like the 50 other