This blog post shows a few samples of graphs and explains how you can use new functionality in ODS Graphics to make your old graphs look new again. ODS Graphics is part of Base SAS.

This blog post shows a few samples of graphs and explains how you can use new functionality in ODS Graphics to make your old graphs look new again. ODS Graphics is part of Base SAS.

WARNING: This blog post references Avengers: Infinity War and contains story spoilers. But it also contains useful information about random number generators (RNGs) -- tempting! If you haven't yet seen the movie, you should make peace with this inner conflict before reading on. Throughout the movie, Thanos makes it clear
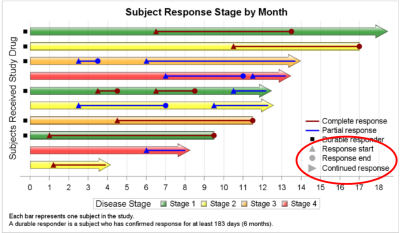
Plot statements included in the graph definition can contribute to the legend(s). This can happen automatically, or can be customized using the KEYLEGEND statement. For plot statements that are classified by a group variable, all of the unique group values are displayed in the legend, along with their graphical representation
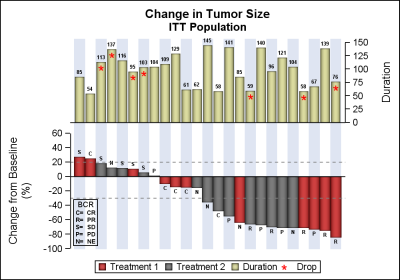
Waterfall plots have gained in popularity as a means to visualize the change in tumor size for subjects in a study. The graph displays the reduction in tumor size in ascending order with the subjects with the most reduction on the right. Each subject is represented by a bar classified by
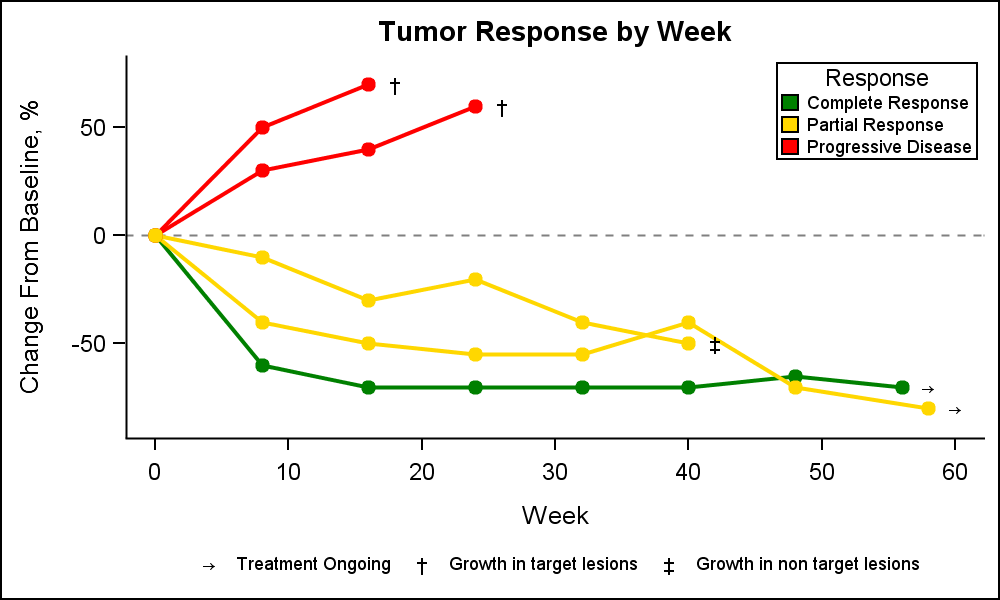
A Spider Plot is another way of presenting the Change from Baseline for tumors for each subject in a study by week. The plot can be classified by response and stage. Another way of displaying Tumor Response data was discussed earlier in the article on Swimmer Plot. This article is prompted
When we first released GTL and SG Procedures back with SAS 9.2, Box Plots and Bar Charts would always treat the category axis as discrete. We realized soon enough that we need to support box plots on scaled interval axes for many clinical applications, and this was added in SAS

If you have programmed with SAS in the last 15 years, you have probably had a reason to share your SAS results in PDF format. The ODS PDF destination, much like a well-designed car, has evolved over the years, offering progressively nicer features like security, enhanced image formatting and embedded
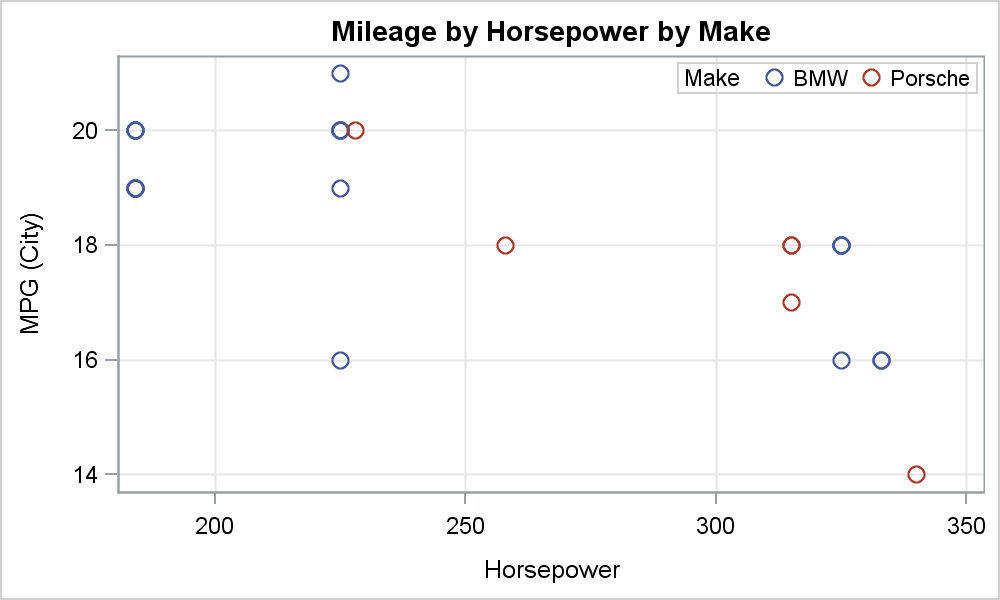
There has been much discussion on the SAS Communities page on usage of different symbols in a graph. The solutioin can vary based on the SAS release. New features have been added at SAS 9.4 releases to SG Procedures and GTL that make this very easy. With SAS 9.4M1, almost any combination is

Beginning with the first maintenance of SAS 9.4, you have the ability to define your own symbol markers using the SYMBOLCHAR and SYMBOLIMAGE statements. With these statements you can select a Unicode value or you can select an image file that exists on the local file system—making the possibilities for
Users have often expressed the need for more marker symbols. ODS Graphics supports over 30 scalable marker symbols, both filled and empty. As mentioned in an earlier article, with SAS 9.4, filled markers can now have outlines and fills, and can also have special effects. Also with SAS 9.4, now you