When we first released GTL and SG Procedures back with SAS 9.2, Box Plots and Bar Charts would always treat the category axis as discrete. We realized soon enough that we need to support box plots on scaled interval axes for many clinical applications, and this was added in SAS 9.3.
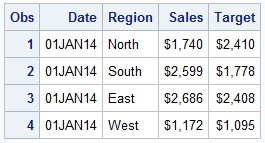 The same is now true for Bar Chart. With SAS 9.40M3, a bar chart can now display data on a scaled interval axis like Linear, Time or Log. For this article, I created a simple data set of simulated revenues by region and date. The dates are 01Jan2014, 07Jan2014, 15Jan2014, 01Feb2014, 01Mar2014 and 01Apr2014. A few observations for the data set are shown on the right.
title 'Revenues by Date';
proc sgplot data=Sales noborder cycleattrs;
vbar date / response=sales nostatlabel dataskin=pressed;
xaxis type=time display=(nolabel noline);
yaxis grid;
run;
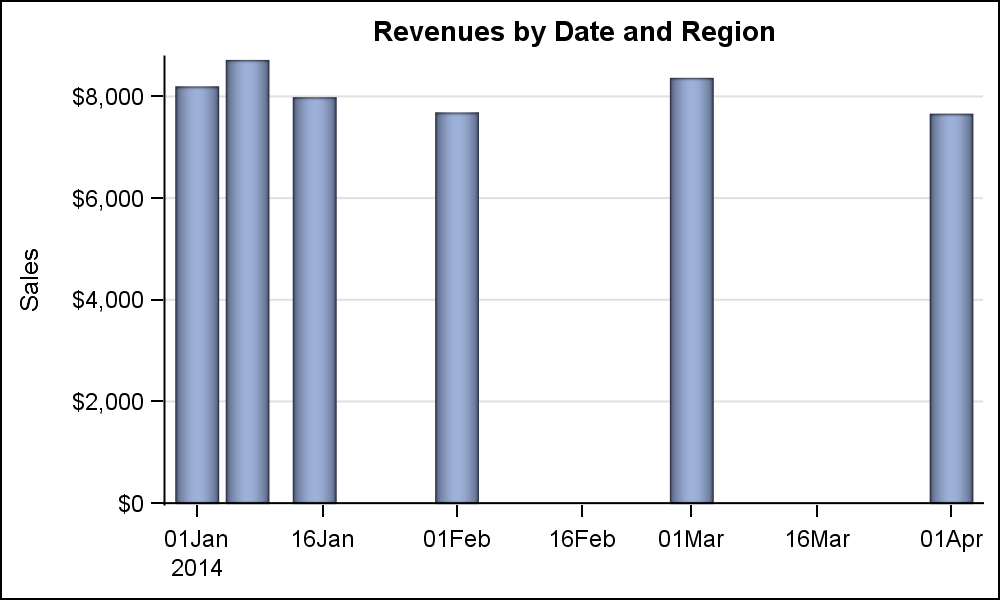 The graph on the right shows the Revenues by Date and the x-axis TYPE has been set to "Time". Each bar is now drawn in the correct scaled position along the x-axis displaying the summarized value for Revenues.
One might ask what is the benefit of this over a needle plot which can do something similar.
- A needle plot does not summarize the data by the category value.
- The needles are plotted as lines with a thickness of 1 pixel, or as set by user.
- The bar does a good job of setting the bar width, using the default 85% of the "effective" midpoint spacing, which is determined by the minimum spacing between the values on the x-axis. This behavior is very similar the the box plot on interval axis and works well for cluster groups.
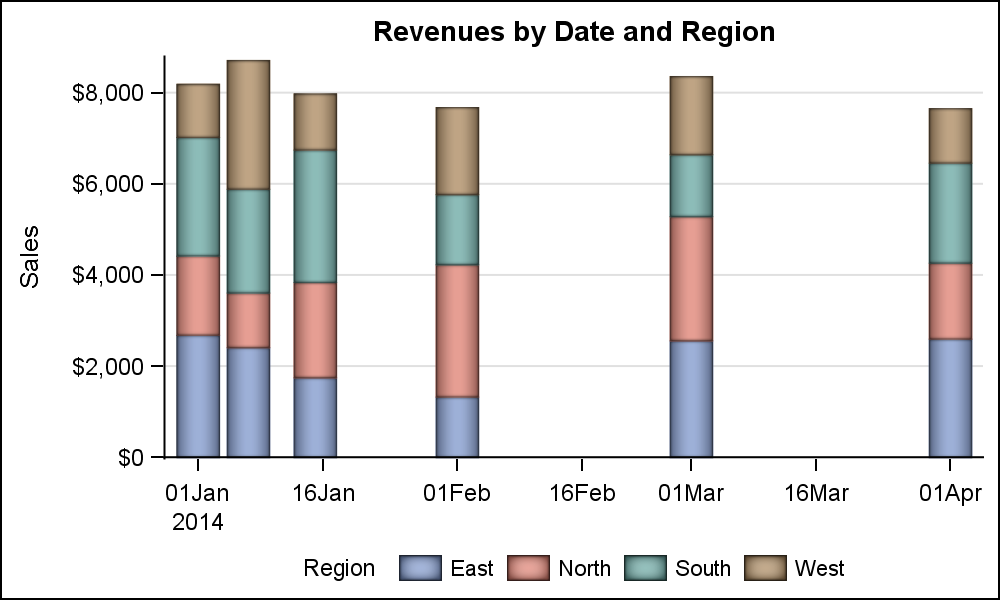 Another bar feature that just works in this case is the default stacked and cluster groups. For the graph on the right, the data is summarized by date and region and plotted as stacked bars on the scaled time axis.
By default (without setting the TYPE option), the behavior remains the same as before, and the bar chart will still force a discrete axis. There will be no change for your existing programs.
Note the legend at the bottom. I have used the new SAS 9.40M3 Legend options FILLHEIGHT and the FILLASPECT to get larger skinned color swatches.
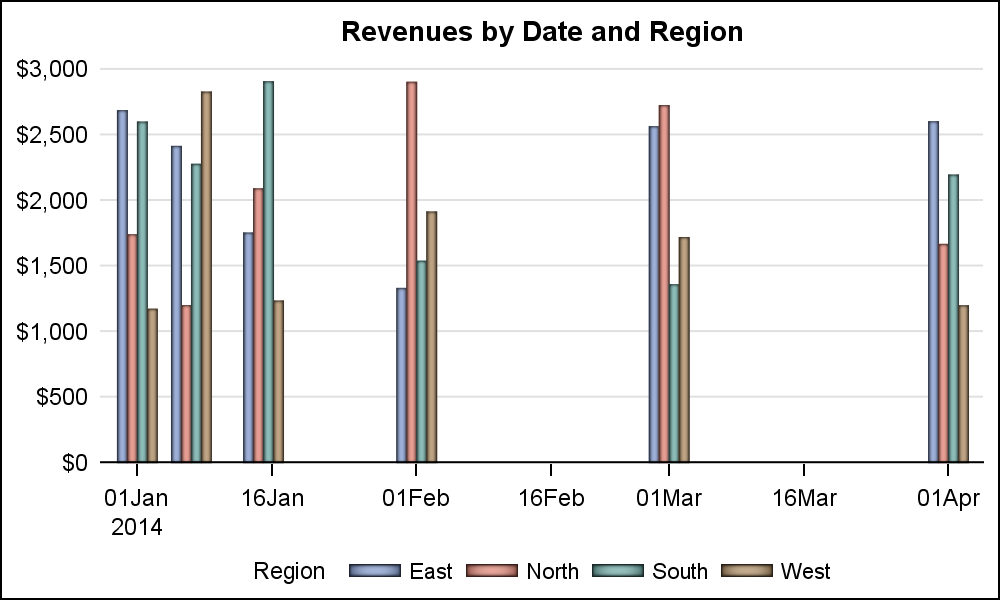 For cluster groups, the cluster width is determined by the minimum distance between the values on the x-axis. Now the bar widths are correctly sized to fit all the four regions in the "Effective" midpoint spacing. Since the smallest interval is 7 days on the left side of the graph, the available spacing for each cluster is determined by that. To improve the clustering effect, I have set clusterwidth=0.75.
Also, I have customized the legend swatches to a thinner and longer shape to match the thinner bars in the graph. The new options allow you to do such customization.
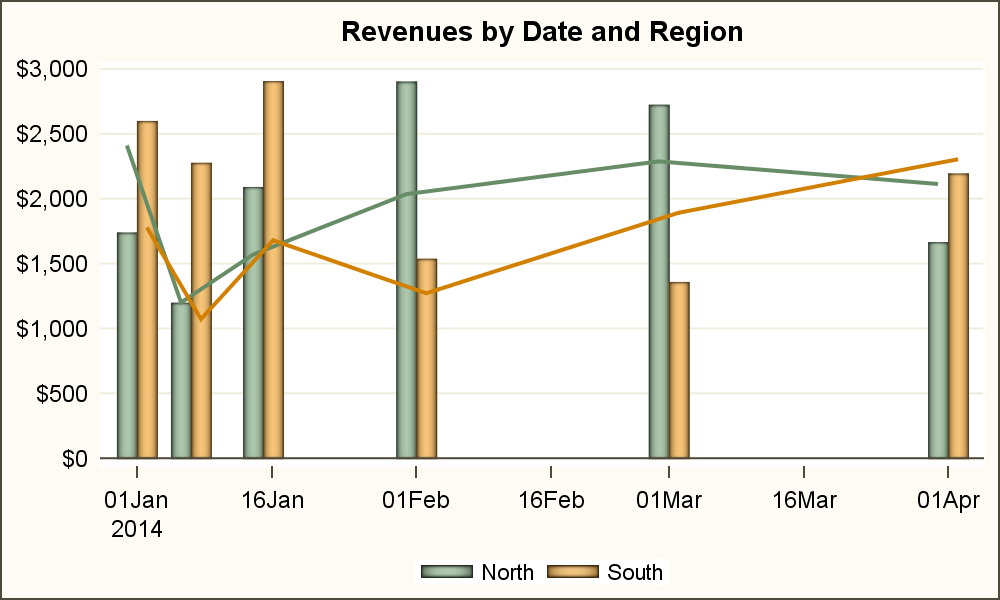 The interval axis VBAR can also be used in conjunction with the VLINE to create a BarLine graph on a time axis. Here, the bars show Sales by date for two regions. The line shows the Target by date for the two regions. Both statements use GROUPDISPLAY=CLUSTER to the right colored lined join the same colored bars.
Recently there was a question on the communities web site from a user who wanted to plot a bar chart with target values. The graph above displays the target values using a VLINE plot. However, a full line overlay may not be desirable, and we may want individual markers over each bar to indicate the target for just that bar. We can extend the above technique to do something like the graph shown below. Click on the graph for a detailed view. I would agree the target markers may need more emphasis.
 Normally, one cannot overlay a "basic" plot like scatter on a VBAR statement to display the target values. You would have to first summarize the data using PROC MEANS, and then use a combination of the VBarParm overlaid with a scatter or other basic plot.
For this graph, we have overlaid the VBAR with a VLINE, and turned on markers and turned off the display of the line by setting the following option.
vline date / response=target group=region markers lineattrs=(thickness=0);
This will draw the default marker on each bar, and we can change the marker shape to one of the supported shapes. However, since there is no "Bar" shape available, we have used the SYMBOLCHAR statement to define a custom marker called "Line" using one of the characters from the Unicode font.
symbolchar name=line char='2012'x / voffset=0.08;
Note the use of the VOFFSET=0.08. If you overplot a regular marker on the line marker defined using SYMBOLCHAR, you will see they do not line up exactly. This is because in the character glyph defined for value '2012'x, the line is not exactly in the middle of the glyph bounding box. This can convey the wrong value to the graph consumer. So, I have used the VOFFSET to shift the line up a bit to ensure it is exactly lined up with a regular marker. The voffset feature was added just such cases.
Now, you have one more tool in your tool box to create effective graphs. The interval bar chart should fill a gap and make it easier to create graphs.
Full SAS 9.40M3 Code: Interval_Bar


2 Comments
Hi Mr. Matange,
I was trying to generate swimmer plot with patterns for each group (A, B, C) using GTL. I want to specify which pattern goes to which group. I tried the attribute map mentioned in your book "Getting Started with the Graph Template Language in SAS". But could not find the solution. I am wondering if you have any suggestions.
I appreciate your answer.
Sincerely,
Ming Yang
I don't think fill patterns can be assigned in Discrete Attr Map. If you know the order for the patterns you want, set them in that order in the style. Then, ensure that your group values are in the same order in the data (or add dummy values at the top). Or, with GTL, you can use the INDEX option to assign specific GraphData0-12 element for each bar.