The real reason companies cleanse the historical demand is that traditional forecasting solutions were unable to predict sales promotions or correct the data automatically for shortages, or outliers. To address the short comings of traditional technology, companies embedded a cleansing process of adjusting the demand history for shortages, outliers, and
Search Results: simulation (462)
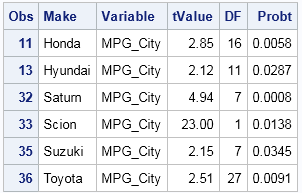
SAS procedures can produce a lot of output, but you don't always want to see it all. In simulation and bootstrap studies, you might analyze 10,000 samples or resamples. Usually you are not interested in seeing the results of each analysis displayed on your computer screen. Instead, you want to

Perhaps you saw the headlines earlier this week about the fact that it has been nine years since the last major hurricane (category 3, 4, or 5) hit the US coast. According to a post on the GeoSpace blog, which is published by the American Geophysical Union (AGU), researchers ran

Last week I attended SAS Global Forum 2015 in Dallas. It was packed with almost 5,000 attendees. I learned many interesting things at the conference, including the fact that you need to arrive EARLY to the statistical presentations if you want to find an empty seat! It was gratifying to
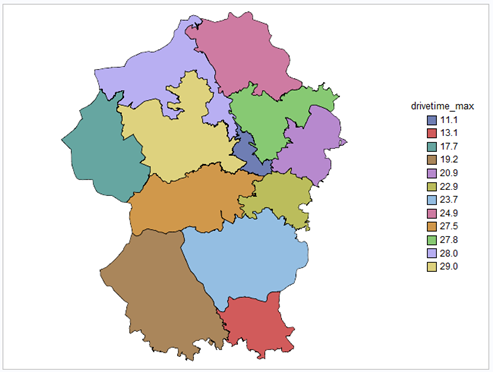
The primary objective of many discrete-event simulation projects is system investigation. Output data from the simulation model are used to better understand the operation of the system (whether that system is real or theoretical), as well as to conduct various "what-if"-type analyses. However, I recently worked on another model
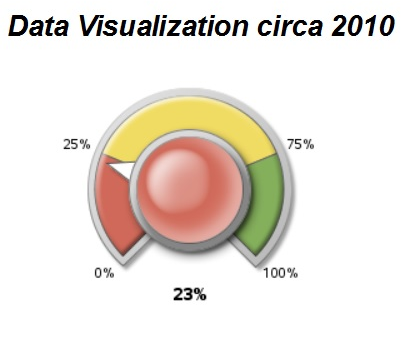
A colleague and I were looking for a good example of how analysts used to use graphics to report data, a data visualization before and after, so to speak. We needed a good "before" screenshot for a “before and after” comparison for our SAS Global Forum 2015 paper, Visualizing Clinical Trial Data.

I'm not just talking about all the energy put in planning, scheduling, and supporting this great event, which is in Dallas, TX next week, April 26-29. I'm talking about all the presentations about using analytics in energy related industries, particularly in Utilities and in Oil and Gas. There is a

Today is my 600th blog post for The DO Loop. I have written about many topics that are related to statistical programming, math, statistics, simulation, numerical analysis, matrix computations, and more. The right sidebar of my blog contains a tag cloud that links to many topics. What topics do you,

I was recently asked by a customer if they should move the responsibility for creating the statistical baseline forecast. They were considering moving it from their regional country offices to their global headquarters. In addtion, they were considering changing the role of their regional demand planners to only make adjustments to

The 2015 SAS Global Forum is in Dallas, TX, and I'll be there. There are many talks to see and people to meet, so thank goodness for the agenda builder, which enables you to create a schedule in advance. I always enjoy talking with SAS customers about statistics, simulations, matrix

The Monty Hall Problem is one of the most famous problems in elementary probability. It is famous because the correct solution is counter-intuitive and because it caused an uproar when it appeared in the "Ask Marilyn" column in Parade magazine in 1990. Discussing the problem has been known to create
This SAS tip comes from Clement A. Stone and Xiaowen Zhu, authors of Bayesian Analysis of Item Response Theory Models using SAS. Item response theory (IRT) models are the models of choice for analyzing item responses from assessments in the educational, psychological, health, social, and behavioral sciences. SAS PROC MCMC
In February of this year, the Washington Business Journal reported the US Government appointed its first Chief Data Scientist, DJ Patil. With this, I think it’s now safe to say that Data Science is officially sanctioned as new mode in organizations. Those that can apply the necessary finesse along with
Bei der Herstellung von hochauflösenden Flüssigkristallanzeigen (engl. lyquid cristal display, LCD) werden chromophore Farbpigmente auf Nanometergröße gemahlen und dann weiterverarbeitet. Dieser Mahlprozess ist teuer. Ein Erkennen und Bestätigen der Hauptursachen für eine kürzere Mahlzeit sind somit zeit- und kostenkritisch. Doch wie geht man vor, wenn man aufgrund starker Wechselwirkungen (ein
This article show how to run a SAS program in batch mode and send parameters into the program by specifying the parameters when you run SAS from a command line interface. This technique has many uses, one of which is to split a long-running SAS computation into a series of

Downstream data have been electronically available on a weekly basis since the late 1980s. But most companies have been slow to adopt downstream data for planning and forecasting purposes. Let's look at why that is. Downstream data is data that originates downstream on the demand side of the value chain. Examples

♦We learned this week that SAS is ranked #4 on Fortune's 100 Best Companies to Work For in 2015. This makes six straight years ranking in the top four (including twice at #1). ♦The March/April 2015 issue of Analytics Magazine includes a SAS company profile by my colleague Kathy Lange. As
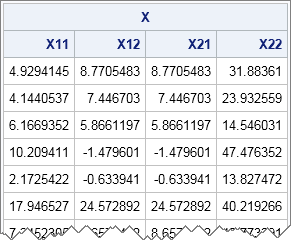
The SAS DATA step supports multidimensional arrays. However, matrices in SAS/IML are like mathematical matrices: they are always two dimensional. In simulation studies you might need to generate and store thousands of matrices for a later statistical analysis of their properties. How can you accomplish that unless you can create
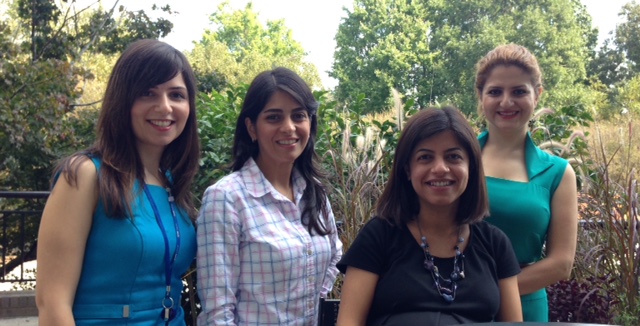
Because finding analytical talent continues to be a challenge for most, here I offer tips 5, 6, and 7 of my ten tips for finding data scientists, based on best practices at SAS and illustrated with some of our own “unicorns.” You can read my first blog post for why they

In my book Simulating Data with SAS, I discuss a relationship between the skewness and kurtosis of probability distributions that might not be familiar to some statistical programmers. Namely, the skewness and kurtosis of a probability distribution are not independent. If κ is the full kurtosis of a distribution and

Why do people steal ATMs? Because that's where the money is!!! While the old "smash-n-grab" remains a favorite modus operandi of would-be ATM thieves, the biggest brains on the planet typically aren't engaged in such endeavors (see Thieves Steal Empty ATM, Chain Breaks Dragging Stolen ATM, An A for Effort). And of
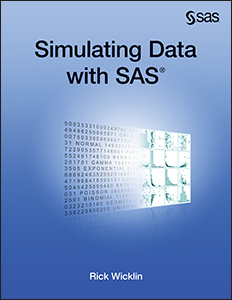
Data simulation is a fundamental technique in statistical programming and research. My book Simulating Data with SAS is an accessible how-to book that describes the most useful algorithms and the best programming techniques for efficient data simulation in SAS. Here are five lessons you can learn by reading it: Learn strategies

I began 2015 by compiling a list of popular articles from my blog in 2014. Although this "People's Choice" list contains many interesting articles, some of my favorites did not make the list. Today I present the "Editor's Choice" list of articles that deserve a second look. I've highlighted one

The Lancaster Centre for Forecasting is seeking Master Student Projects in Forecasting, Data Mining, or Analytics for summer of 2015. Projects normally run from mid-May to mid-August, with reports issued a few weeks after. These projects are a cost efficient way for a company to carry out analytical work by
Last week, I spoke to Suneel Grover, senior solutions architect for digital intelligence at SAS, about how better data and integration can drive improvements in web analytics. This week I wanted to see how this could be applied for a hospitality company. We decided to tackle a frequently debated topic in
In my previous post I explained that even if your organization does not have anyone with data steward as their official job title, data stewardship plays a crucial role in data governance and data quality. Let’s assume that this has inspired you to formally make data steward an official job title. How
I generally don’t use this blog to air my personal experiences, but recent events have reminded me of a few things that I think would benefit our Analytic Hospitality Executives and their organizations to also be reminded of. This past week, I took my fifth trip to Asia this year.
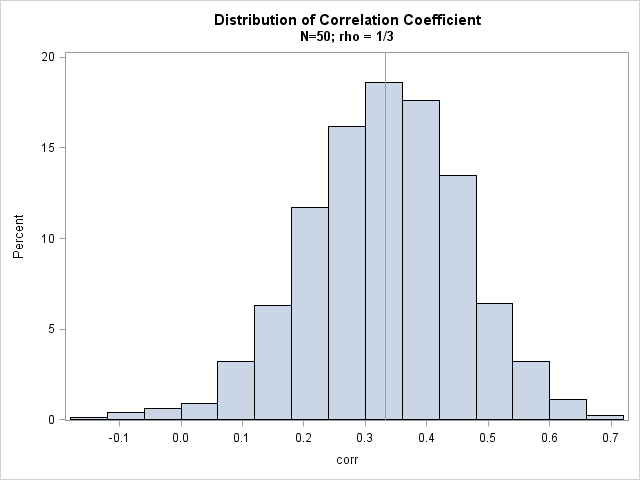
I've written about how to generate a sample from a multivariate normal (MVN) distribution in SAS by using the RANDNORMAL function in SAS/IML software. Last week a SAS/IML programmer showed me a program that simulated MVN data and computed the resulting covariance matrix for each simulated sample. The purpose of

The 2014 INFORMS Annual Conference in San Francisco was quite a success. Record attendance, diverse program, great city, lovely weather: who can ask for more? SAS and, in particular, SAS/OR was well-represented with a number of talks in all areas of operations research. Here is a somewhat arbitrary selection, please click

My colleagues at the SAS & R blog recently posted an example of how to program a permutation test in SAS and R. Their SAS implementation used Base SAS and was "relatively cumbersome" (their words) when compared with the R code. In today's post I implement the permutation test in


