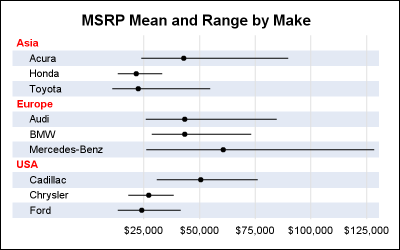
The previous post on Multiple Blank Categories showed how to include multiple blank categories on the axis. But, given the purpose for this was to separate different segments in the data, I also included ideas on how to segmented a discrete axis using reference lines or Block Plot. A similar idea
Tag: Forest Plot
Axis tables can use the SUM= option to summarize data and display means, medians, sums, and percentages. They can instead be used to display data, text, and statistics without any summarization.
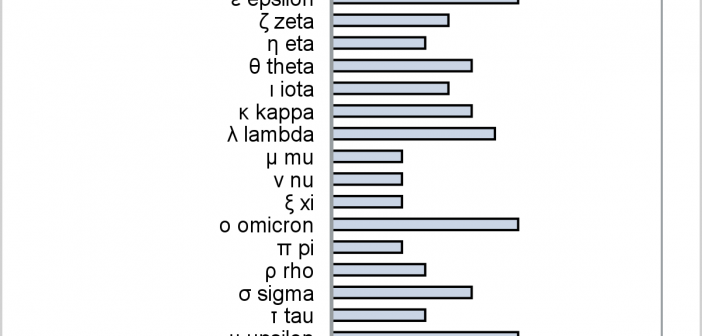
This post provides a general macro that enables you to easily display special characters (Unicode) in axis table columns.
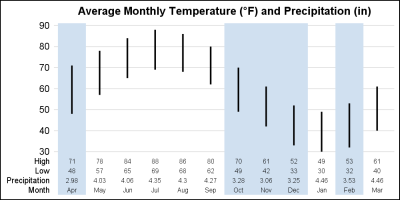
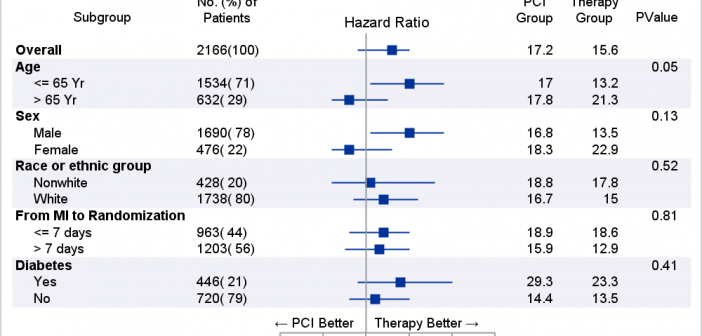
One key aspect of graphs used in the statistical or clinical research domains is the need to display numerical or textual information aligned with the data in the plot. Examples of such graphs are the Survival Plot or the Forest Plot. These graphs use the AXISTABLE statements available with SAS
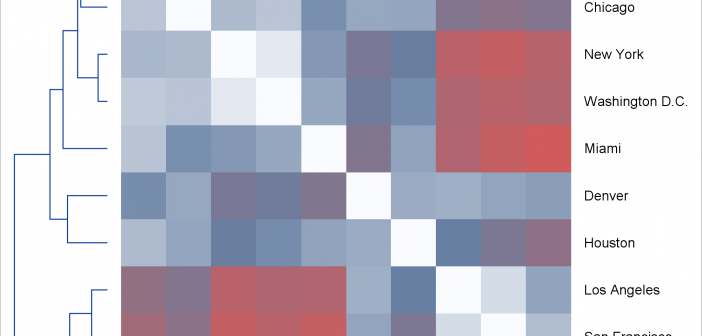
Today, I focus on the steps needed to make a graph that is composed of multiple heterogeneous components (in this case, dendrograms and a heat map).
Last week I had the pleasure of presenting my paper "Graphs are Easy with SAS 9.4" at the Boston SAS Users Group meeting. The turn out was large and over 75% of the audience appeared to be using SAS 9.4 back home. This was good as my paper was focused on the cool new
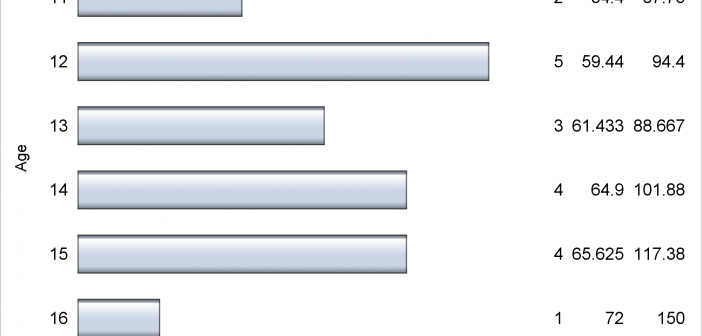
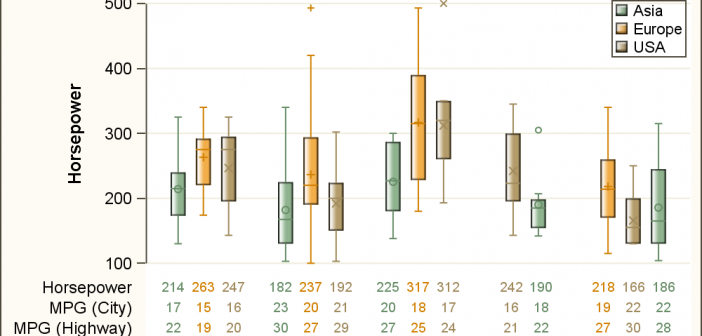
As often is the case, this article is prompted by a recent post on the SAS/GRAPH and ODS Graphics page communities page. A user wanted to create a Graph Table showing a bar chart with tabular data for each of the category values along the x-axis. The user was creatively using
The advent of the AXISTABLE statement with SAS 9.4, has made it considerably easier to create graphs that include statistics aligned with x-axis values (Survival Plot) or with the y-axis (Forest Plot). This statement was specifically designed to address such needs, and includes the options needed to control the text attributes of
Most regular readers may have already noticed the release of my new book "Clinical Graphs using SAS", as indicated by the icon of the book cover and the link to the SAS Press page under the "About this blog" section on the right. This book is a result of the various
I have written a new book on advanced ODS Graphics examples. It is available as a free PDF file on the web. It is in color, and all of the SAS code is available by double clicking a link at the beginning of each example. Advanced ODS Graphics Examples Update: