Tag: Forest Plot

Data Visualization
Sanjay Matange 23
Forest Plot with Subgroups

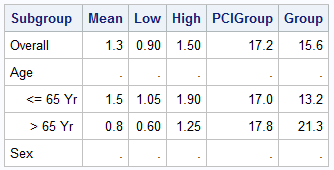
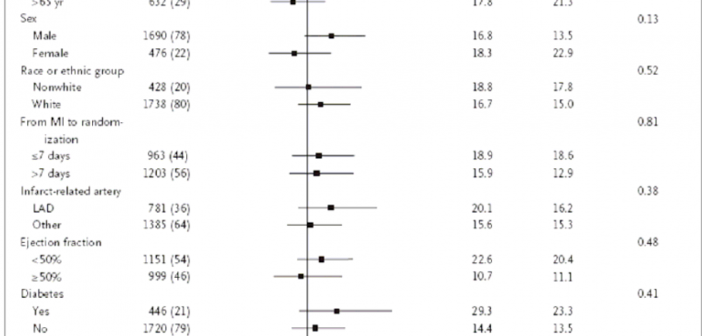
During SAS Global Forum 2012, I had conversations with many SAS users who wanted to create Forest Plots.  However, there was one new twist.  The study names were subgrouped by categories like 'Age', 'Sex', etc., with multiple entries under each subgroup.  The name of each study within the subgrouped was indented

Data Visualization
Sanjay Matange 8
Non-breaking space

Forest plots come in many flavors.   An example of a Forest plot using GTL is available on the SAS support web site.  Simple forest plots can also be created using SGPLOT procedure by using the SCATTER statement with MARKERCHAR to display data aligned with the plot by study names. One issue

Data Visualization
Sanjay Matange 0
PharmaSUG 2012 update

PharmaSUG 2012 conference drew to a close today, concluding two and a half days packed with papers, presentations, posters, hands-on demos and super demos by SAS staff.  While the weather outside was a bit chilly from time to time, the conference what hopping with many user papers on how to