Search Results: symbol= (103)

Data Visualization
Sanjay Matange 0
Doing more with nbsp

A few weeks ago I wrote an article on using the non breaking space character to prevent stripping of leading and trailing blanks in a string.   Since then, I have discovered a few more instances where the nbsp can be a useful tool for creating graphs. One such instance came up last week

Data Visualization
Sanjay Matange 8
Non-breaking space

Forest plots come in many flavors.   An example of a Forest plot using GTL is available on the SAS support web site.  Simple forest plots can also be created using SGPLOT procedure by using the SCATTER statement with MARKERCHAR to display data aligned with the plot by study names. One issue

Data Visualization
Sanjay Matange 0
Broken Y-Axis with SAS 9.2

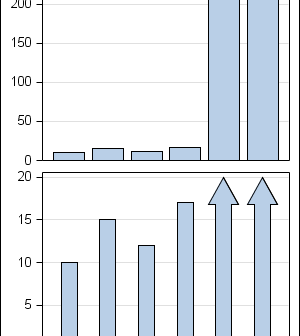
In the previous post on Broken Y-Axis, I reviewed different ways to display data as a Bar Chart, where the response values for some categories are many orders of magnitude larger than the other values.  These tall bars force  the display of other values to be squeezed down thus making it harder to compare

Data Visualization
Sanjay Matange 3
Just a legend, please

Recently, an interesting question was posed on the previous article on this blog by a reader.  Can we use the new DiscreteAttrMap feature to create just a legend with specific entries, with no graph.  The question was intriguing enough that I did not wait to ask - "Why?".  I just got

1 7 8 9 10 11