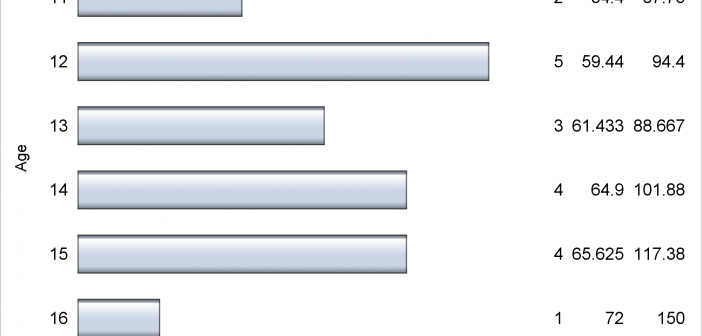
Axis tables can use the SUM= option to summarize data and display means, medians, sums, and percentages. They can instead be used to display data, text, and statistics without any summarization.

Axis tables can use the SUM= option to summarize data and display means, medians, sums, and percentages. They can instead be used to display data, text, and statistics without any summarization.
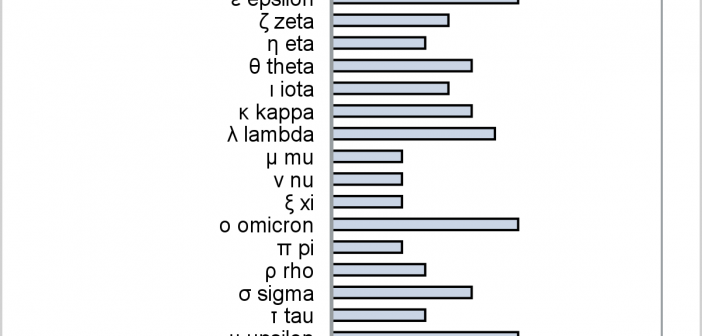
This post provides a general macro that enables you to easily display special characters (Unicode) in axis table columns.
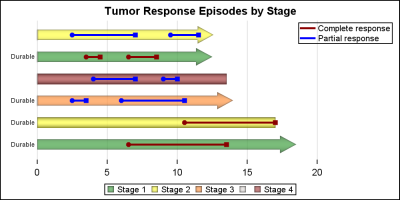
On a recent visit to an In-House Users Group meeting at a Pharmaceutical company, I presented a 1/2 day seminar on creating Clinical Graphs using SG Procedures. Polling the audience for their experience with these procedures indicated that many SAS users are not familiar with these new ways to create graphs. So,
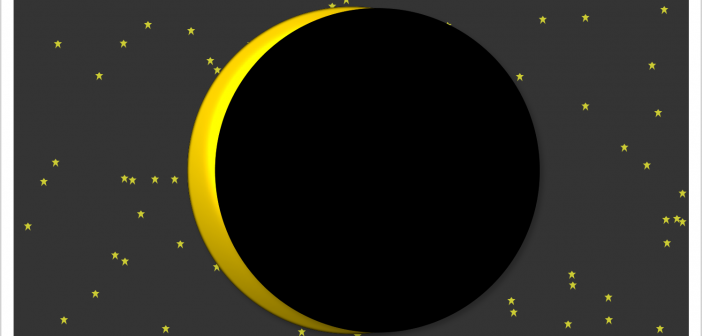
This example shows how to create two coordinated range attribute maps and use them in creating an animated gif of the eclipse.
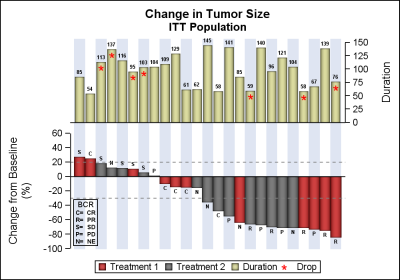
Waterfall plots have gained in popularity as a means to visualize the change in tumor size for subjects in a study. The graph displays the reduction in tumor size in ascending order with the subjects with the most reduction on the right. Each subject is represented by a bar classified by

Recently, while reading up on Wilkinson and Cleveland Dot plots, I saw this excellent article by Xan Gregg on the topic. I also saw some interesting examples of Lollipop Charts, kind of a dot plot with statistics along with a drop line, maybe more suitable for sparse data. I thought
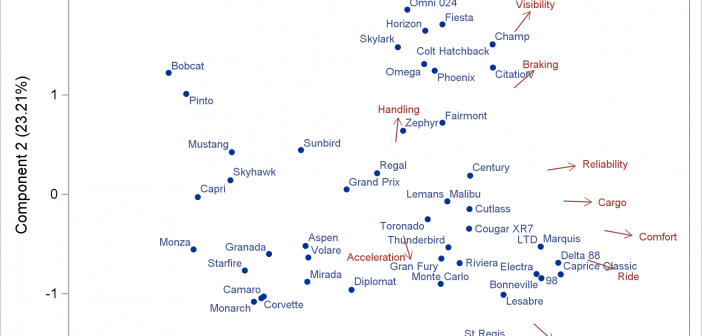
A vector plot draws a line from one point in a graph to another point. In this post, I will show you how to create short vectors instead of vectors that emanate from the origin. I also show how to modify the positions of the vector labels.
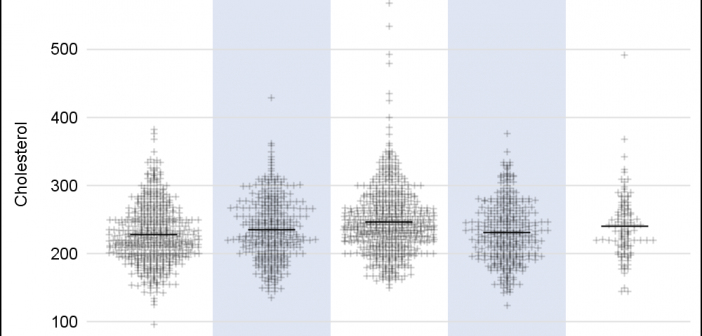
A frequently requested statistical graph is the scatter plot by with discrete categories along with mean value for each category. Searching for a "Scatter with Mean" will return a lot of requests for such a graph in SAS, Stata, R and other statistical software. Such a graph is very easy
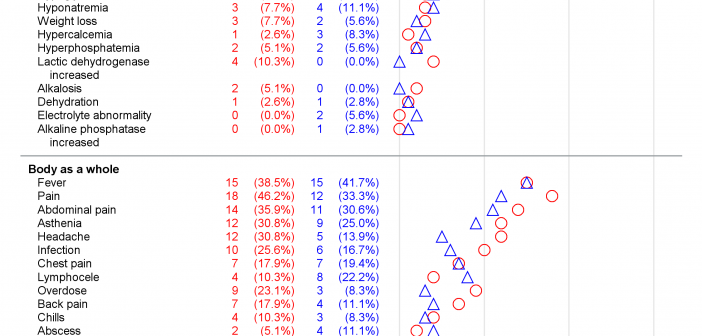
Did you know that you can make a graph extend across multiple pages? Making a multipage graph poses no problem for ODS Graphics---you simply use a BY variable to create page breaks. Most of the work involves deciding where to break pages and properly labeling continuations.
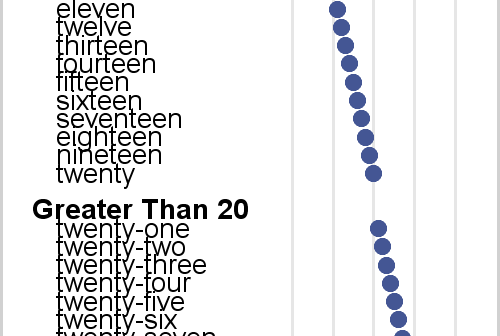
Axis tables enable you to combine tabular and graphical information into a single display. I love axis tables. My involvement with axis tables dates back over 30 years to their ancient predecessor, the table that contains an ASCII bar chart. In the mid 1980s, I created a table in PROC