Search Results: polygon color (40)

Data Visualization
Sanjay Matange 4
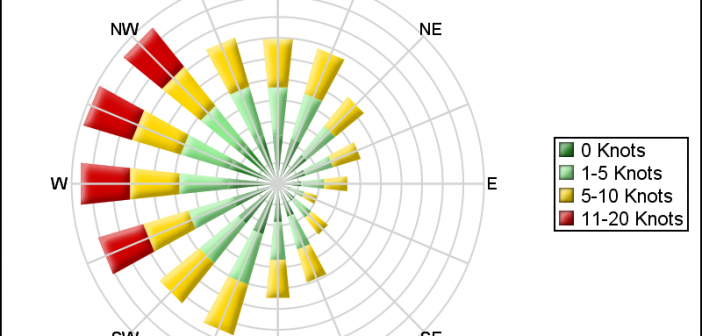
Polar Graph - Wind Rose

Last week I posted an article on displaying polar graph using SAS.  When the measured data (R, Theta) are in the polar coordinates as radius and angle, then this data can be easily transformed into the XY space using the simple transform shown below.     x=r*cos(theta * PI / 180);     y=r*sin(theta * PI

Data Visualization
Sanjay Matange 6
Is that Annotate?

The SGPLOT procedures includes features to add annotations to your graph in many different ways.  Annotations provide you a flexible way to add features to your graph that are not available through the standard plot statements. Recently, I saw this graph on the web that caught my attention.  Clearly, this looks like

Data Visualization
Sanjay Matange 2
Micro Maps

MicroMaps are a powerful way to display data where the display includes small, lightweight maps to provide geographical information regarding the data.  This geographical information gives clues to the relationship between the data that could lead to more insight. The SAS SG Procedures and GTL do not currently have built-in

Data Visualization
Sanjay Matange 6
Layered graphs

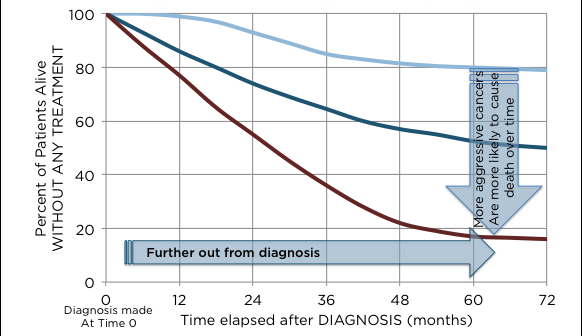
Browsing graphs on the web, this graph caught my eye:  The Arctic Sea Ice Volume Graph.   My interest is not so much in the debate on Climate Change or Global Warming.  To me, this graph has some interesting features that can help show the benefits of plot layering to

Data Visualization
Sanjay Matange 1
Clark Error Grid Graph

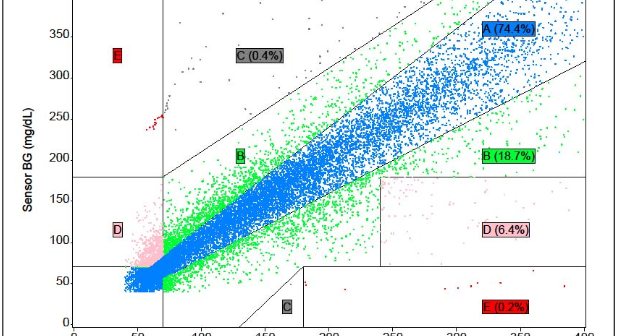
The SAS Global Forum conference last week was awesome.  From the perspective of graphics, there were more papers from uses on graphics and ODS graphics then in recent times.  I will post a summary shortly. One of the interesting papers was "#113-2013 - Creating Clark Error Grid using SAS/GRAPH and Annotate..."

Data Visualization
Sanjay Matange 4
Map overlays

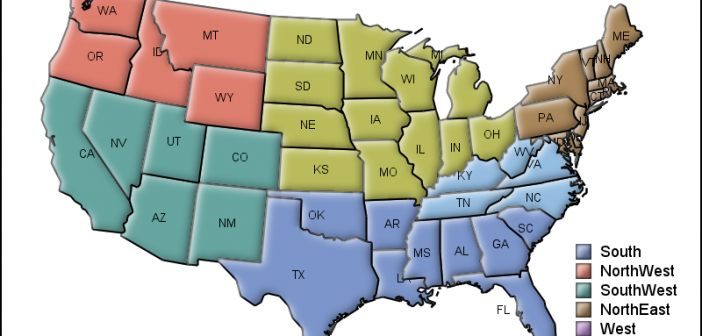
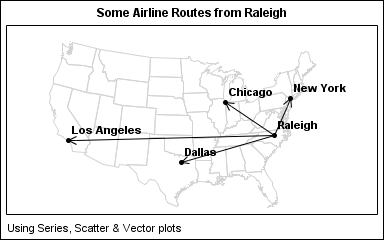
In Simple maps can go a long way, we discussed some techniques to create simple outline maps from map datasets in the MAPS library using GTL.  Now, let us take this a step further to do something more useful with this feature. For some graphs, the map information is an essential part of the