Search Results: highlow (67)

Data Visualization
Sanjay Matange 11
Sankey Diagrams

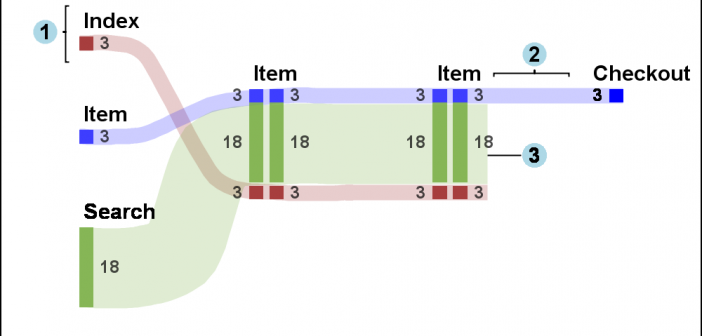
Sankey Diagrams have found increasing favor for visualization of data.  This visualization tool has been around for a long time, traditionally used to visualize the flow of energy, or materials.   . Now to be sure, GTL does have a statement design for a Sankey Diagram which was implemented only in Flex for use

Data Visualization
Sanjay Matange 0
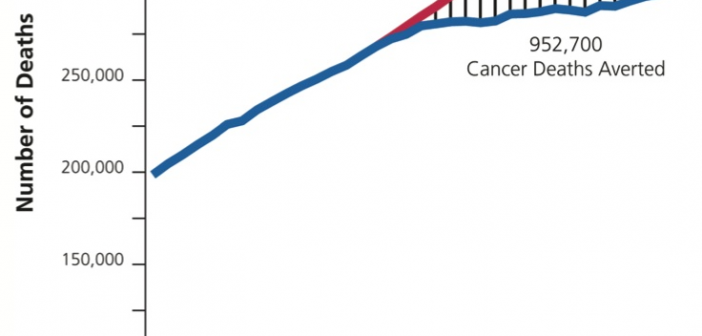
Cancer Deaths Averted

Significant progress in reduction of Cancer mortality is shown in a graph that I noticed recently on the Cancer Network web site.  This graph showed the actual and projected cancer mortality by year for males.  The graph is shown on the right. The graph plots the projected and actual numbers

Data Visualization
Sanjay Matange 4
Likert Graphs

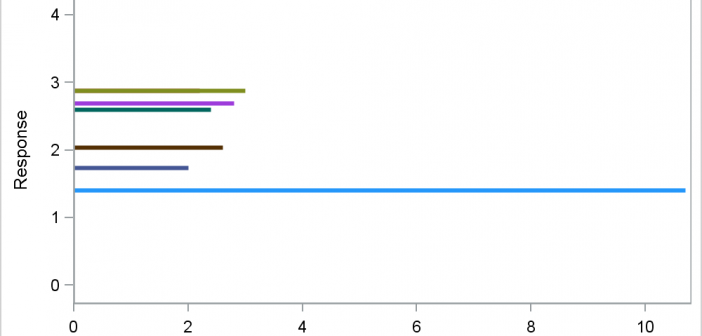
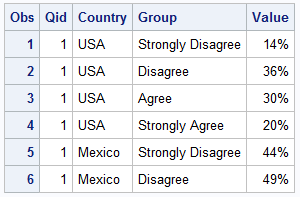
Just this morning I received a request for a brief survey from Apple on my feedback about the new iPhone6+.  Yes, I finally got one, dead last in the family.  The survey followed the usual format, with a number of questions on what I like or dislike about it, with

Data Visualization
Sanjay Matange 3
CandleStick Chart

A HighLow plot is very popular in the financial industry, often used to track the periodic movement of a stock or some instrument or commodity.  The CandleStick Chart is one specific type of high low plot, purportedly originating in Japan for tracking of financial instruments in the rice trade. Creating a

Data Visualization
Sanjay Matange 6
Binary Response Graph

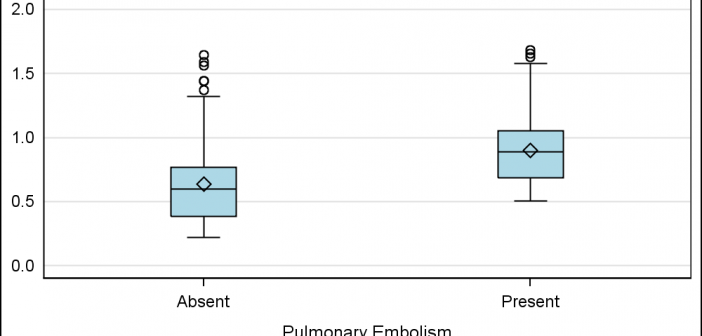
Often we need to plot the response values for binary cases of a classifier.  The graph below is created to simulate one seen at http://www.people.vcu.edu/ web site of the shock index for subjects with or without a pulmonary embolism.  In this case, the data is simulated for illustration purposes only. There

Data Visualization
Sanjay Matange 1
Epidemic Curve Graph

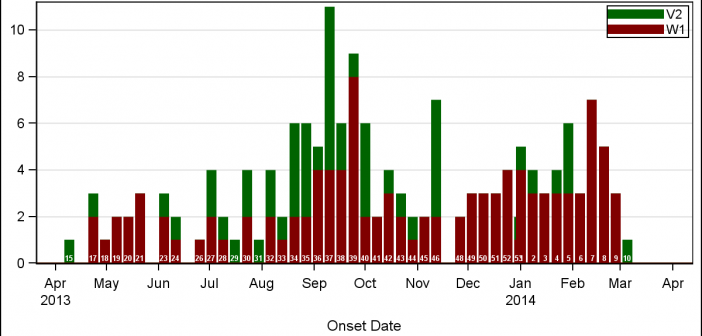
A few weeks back I wrote an article on Grouped Timeline for creating a stacked timeline for onset of different virus.  The idea in that article was to display a stacked needle on a time axis using a HighLow plot. Such graphs are also referred to as EPI or Epidemic Curve