Search Results: highlow (67)

Analytics | Data Visualization | Learn SAS | Programming Tips
Sanjay Matange 0
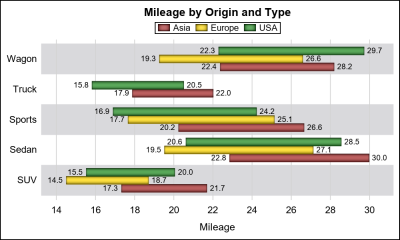
Getting started with SGPLOT - Part 8 - Horizontal HighLow Plot

On a recent visit to an In-House Users Group meeting at a Pharmaceutical company, I presented a 1/2 day seminar on creating Clinical Graphs using SG Procedures.  Polling the audience for their experience with these procedures indicated that many SAS users are not familiar with these new ways to create graphs. So,

Data Visualization
Sanjay Matange 1
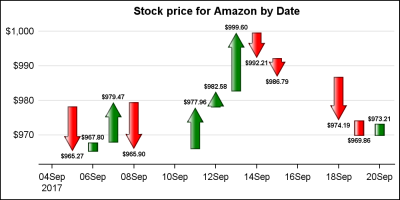
The HIGHLOW Plot

SG Procedures and GTL provide you with a large set of plot statements, such as BarChart, ScatterPlot, BoxPlot and more.  You can use them for the intended purpose, and all is well and good.  However, the real fun starts when you leverage a plot to do something that was not

Data Visualization | Learn SAS | Programming Tips
Sanjay Matange 16
A Graphical Journey

The ODS Graphics software, first released with SAS 9.2, supported creating graphs directly from statistical procedures.  Prior to this, very few statistical procedures created graphs on their own, and in most cases creating graphs was a post process or creating the graphs from the saved data using SAS/GRAPH procedures. With

Data Visualization | Learn SAS | Programming Tips
Sanjay Matange 3
Legend items

Plot statements included in the graph definition can contribute to the legend(s).  This can happen automatically, or can be customized using the KEYLEGEND statement.  For plot statements that are classified by a group variable, all of the unique group values are displayed in the legend, along with their graphical representation

1 2 3 7