Search Results: forest plot (33)

Data Visualization
Sanjay Matange 23
Forest Plot with Subgroups

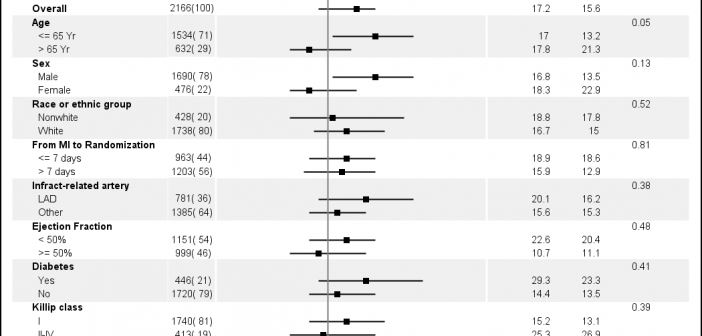
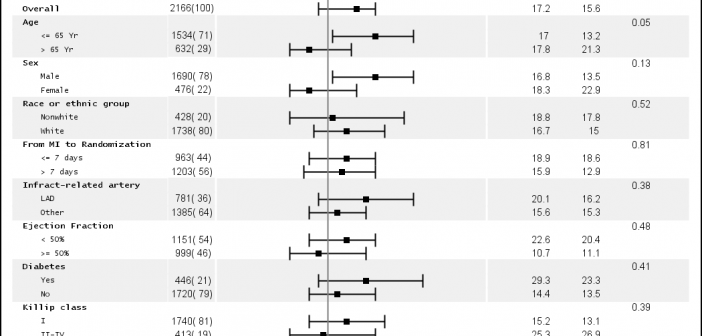
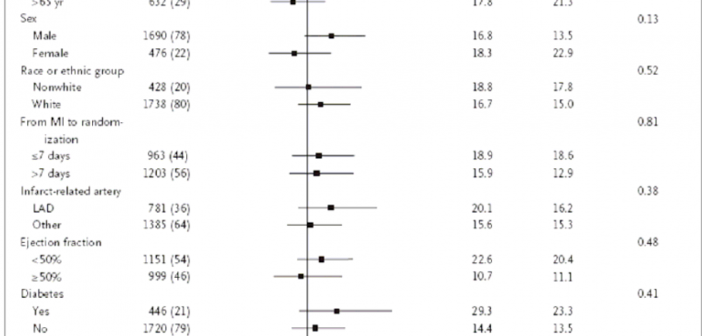
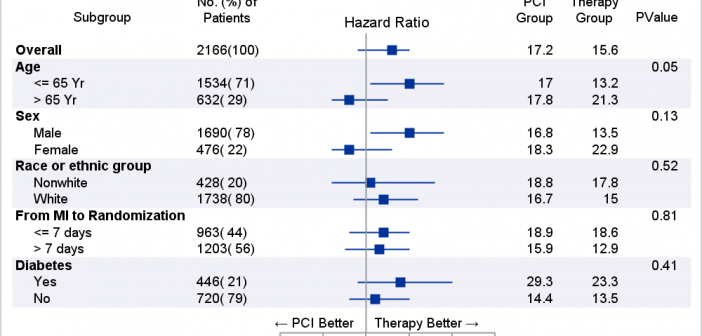
During SAS Global Forum 2012, I had conversations with many SAS users who wanted to create Forest Plots.  However, there was one new twist.  The study names were subgrouped by categories like 'Age', 'Sex', etc., with multiple entries under each subgroup.  The name of each study within the subgrouped was indented

Data Visualization | Learn SAS | Programming Tips
Sanjay Matange 1
Tips and tricks: Segmented discrete axis

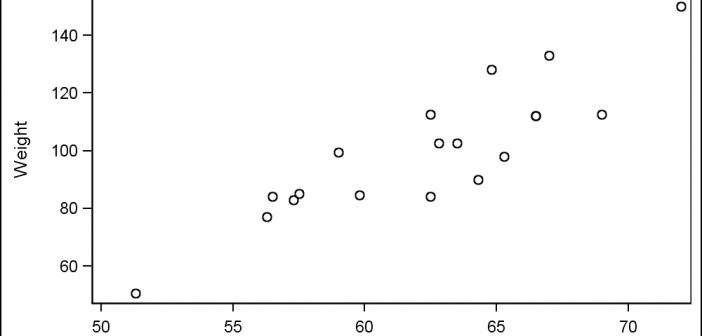
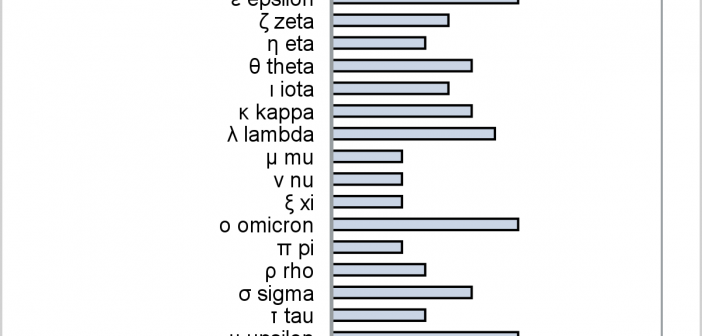
The previous post on Multiple Blank Categories showed how to include multiple blank categories on the axis.  But, given the purpose for this was to separate different segments in the data, I also included ideas on how to segmented a discrete axis using reference lines or Block Plot.  A similar idea

1 2 3 4