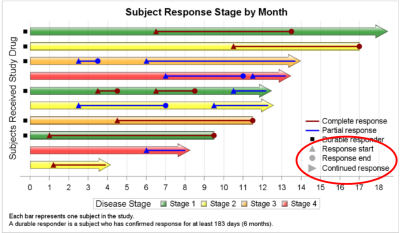
Get the right information, with visual impact, to the people who need it
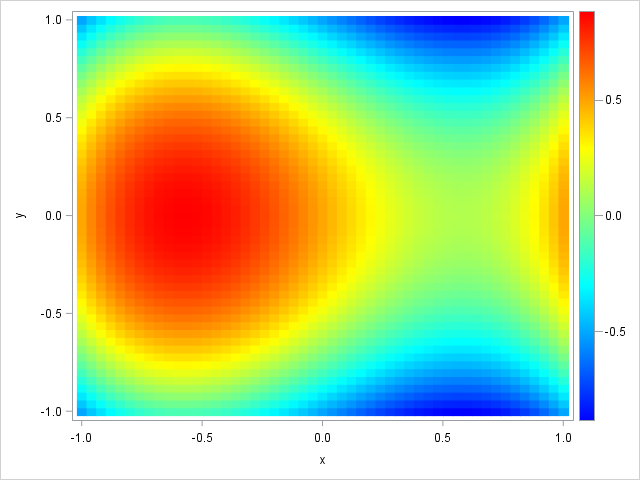
A SAS programming technique to modify ODS templates

This article demonstrates a SAS programming technique that I call Kuhfeld's template modification technique. The technique enables you to dynamically modify an ODS template and immediately call the modified template to produce a new graph or table. By following the five steps in this article, you can implement the technique