Data Visualization

Get the right information, with visual impact, to the people who need it

Data Visualization | Learn SAS | Programming Tips
Sanjay Matange 0
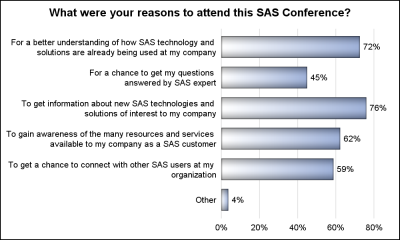
Long category values

The South East SAS Users Group meeting wound up yesterday.  The 25th anniversary conference was held on SAS Campus and it provided a great opportunity to meet with many enthusiastic SAS users and attend many informative presentations.  More on this in a follow-up article. During one of these presentations, Mary

Data Visualization | Programming Tips
Warren F. Kuhfeld 0
Advanced ODS Graphics: A deeper dive into documents, dynamics, and data objects

You can modify all of the components of the graphs that analytical procedures produce: the data object, graph template, and the dynamic variables. This post takes a closer look at dynamic variables (which you can see by using PROC DOCUMENT) and data objects and explores graphs that are constructed from more than one data object.

1 243 244 245 246 247 538