Find out how analytics, from data mining to cognitive computing, is changing the way we do business
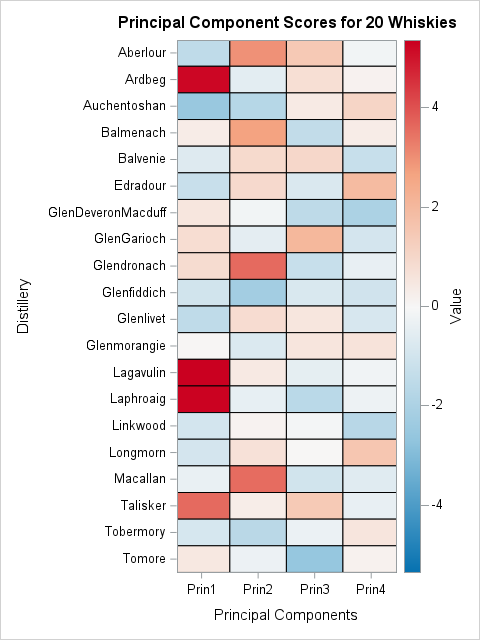
Two new visualizations of a principal component analysis

SAS procedures automatically generate many graphs when you turn on ODS graphics. For example, I have written about how to interpret the graphs that are produced automatically when you use PROC PRINCOMP to perform a principal component analysis (PCA). The built-in graphs are well-designed and informative, but this article discusses