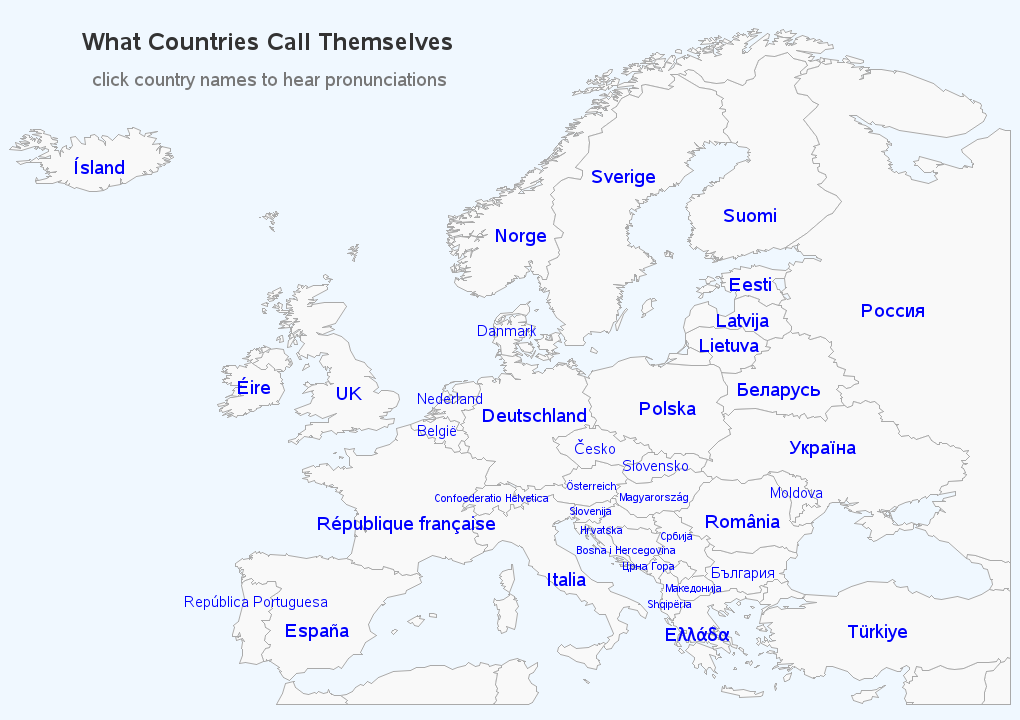
Have you ever had one of those moments when something you had assumed was true all your life, turned out not to be true? I remember that happening in my high school Spanish class (taught by the wonderful Señor Shoaf), when he let us in on a little secret -
Tag: Unicode
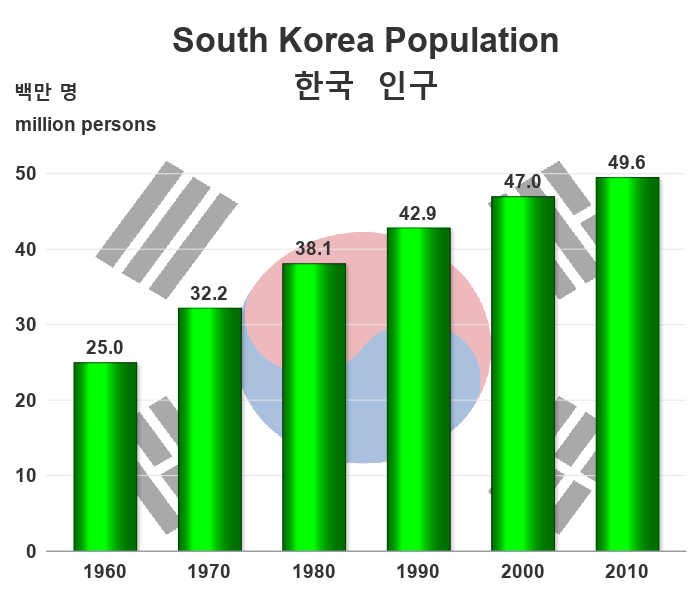
They say "The Sun never sets on the SAS Empire" ... and it's true! There are SAS users all over the world, and SAS output & results could be in any language. Therefore, if you're a SAS programmer, you might need to know how to create SAS graphs with international
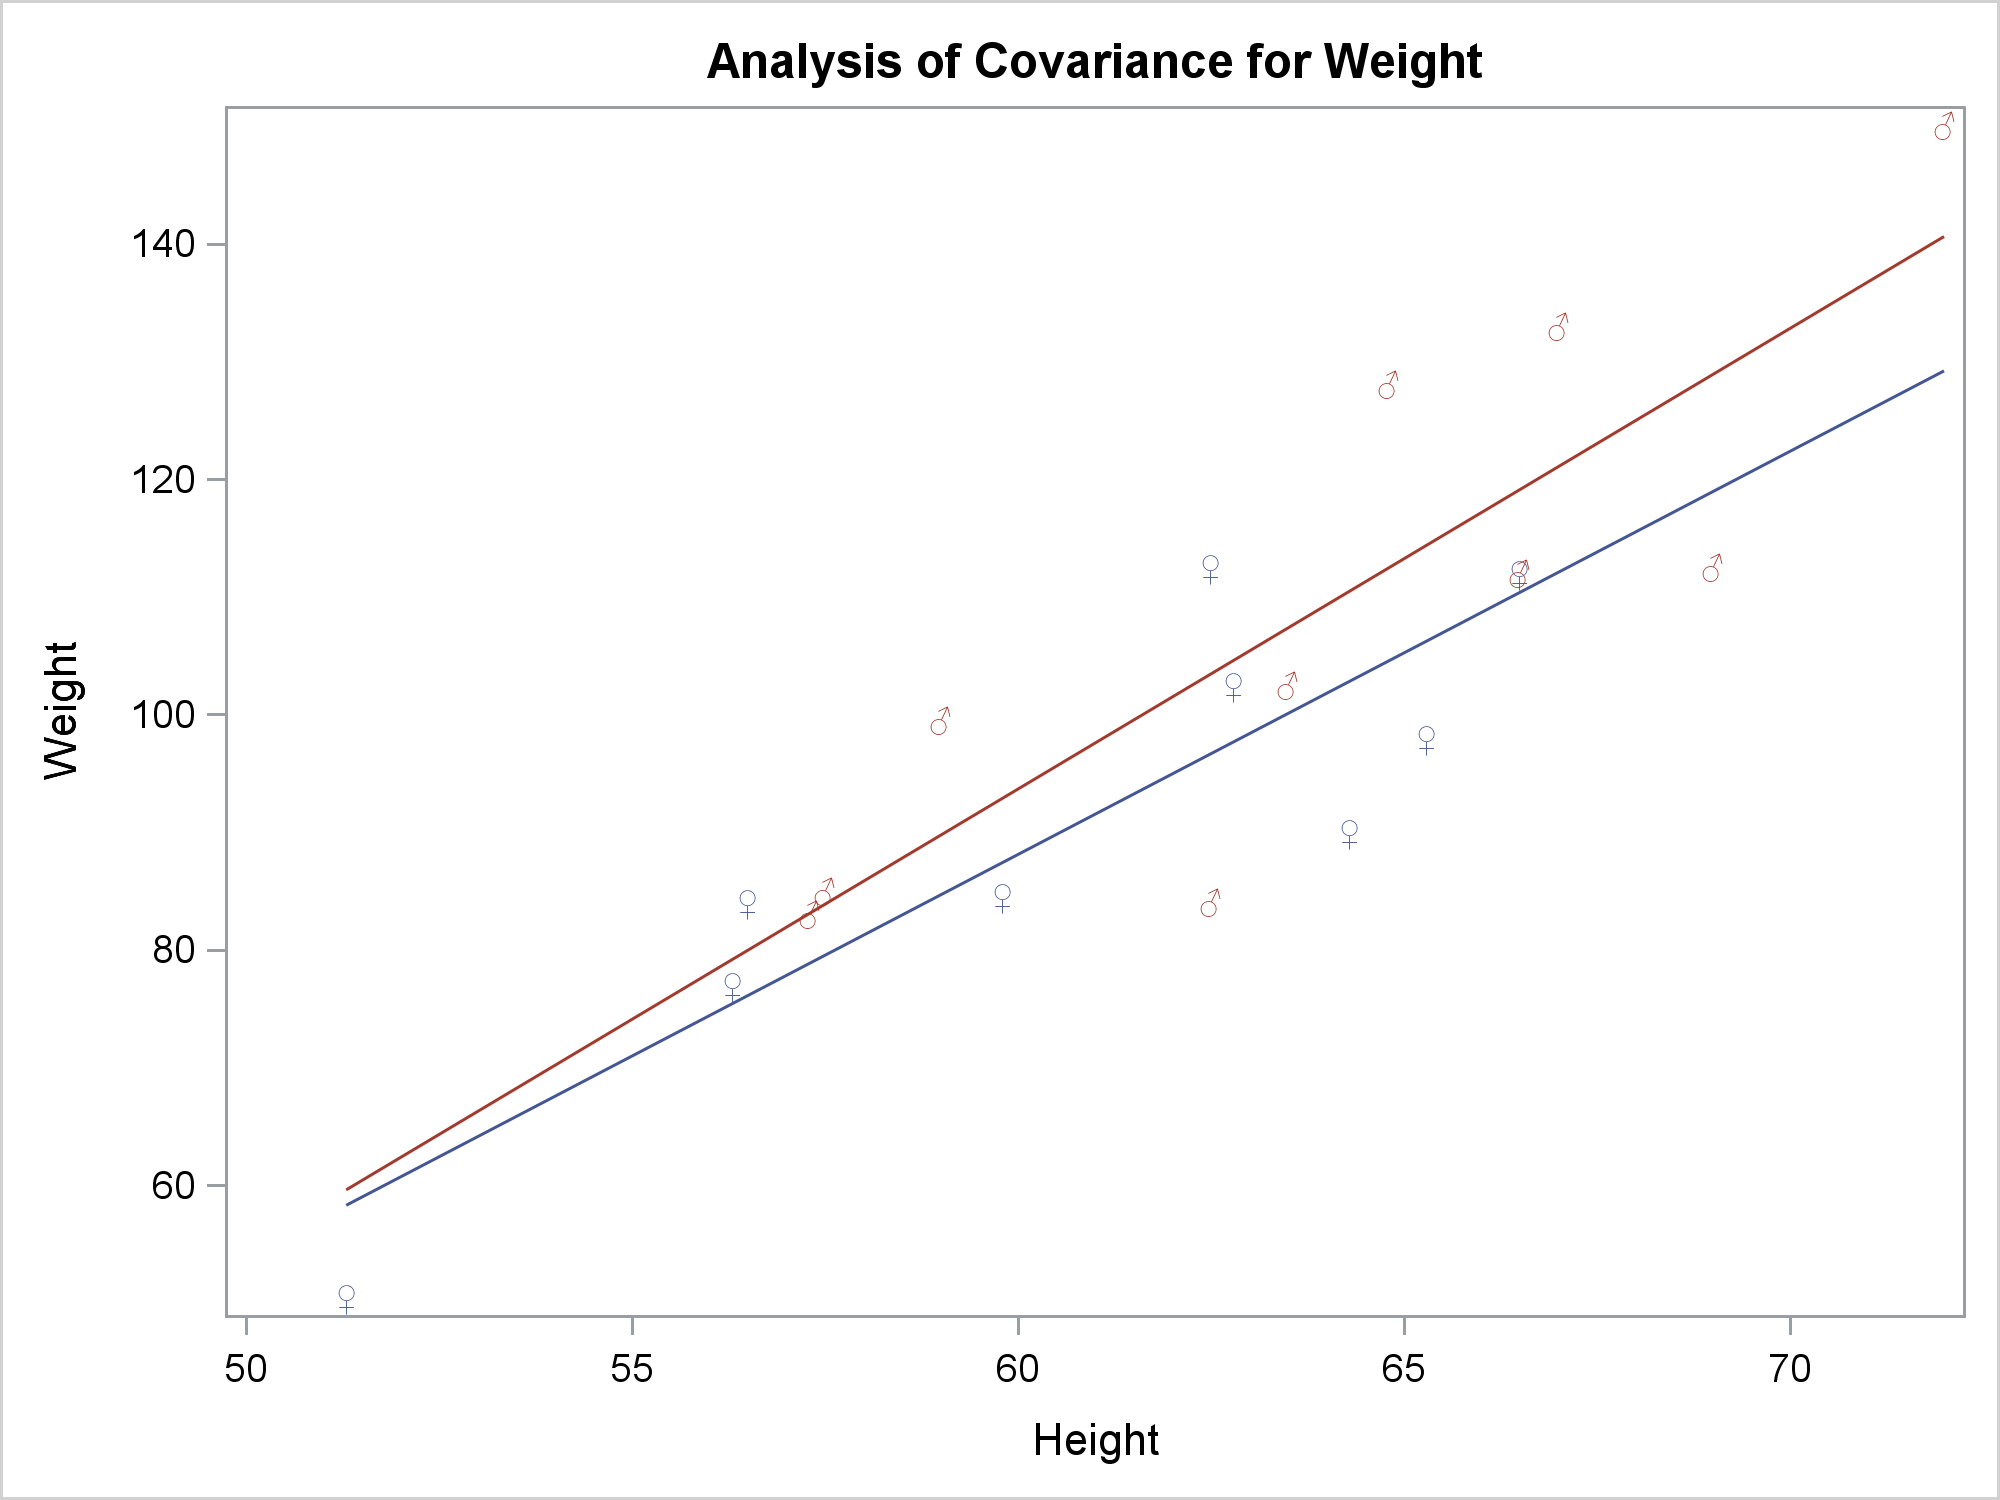
You can use Unicode to display special characters in SAS output including tables and graphs. With graphs that analytical procedures produce, you might need additional steps.
I usually create very technical graphs, that just focus on conveying the information in a concise and straightforward manner (no wasted colors, and nothing to distract you from the data). But sometimes, depending on your audience and the purpose of the graph, you might need to create a graph that
This post shows ways to display the upper or lower triangle of a correlation matrix. You can also use colors to show the magnitude of the correlations.
This post provides a general macro that enables you to easily display special characters (Unicode) in axis table columns.
Doing business in a global economy, have you ever found yourself wanting to show Chinese (or Korean, or Japanese) labels on a map? If so, then this blog is for you! Before we get started, here is a photo of some Chinese characters to get you into the mood. This
SAS 9.4 Maintenance release 3 was released on July 14. The ODS Graphics procedures include many important, useful and cool features in this release, some that have been requested by you for a while. In the next few articles, I will cover some of these features. Last time I covered