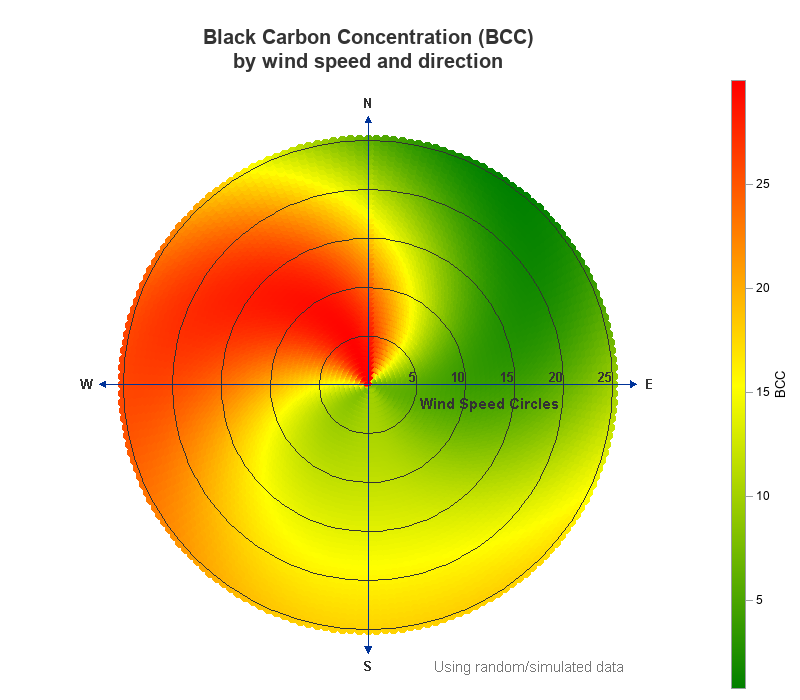
A few years ago Sanjay showed how to create a polar graph by creating a gtl template, and then plotting it using Proc SGRender. These days, Proc SGPlot has all the functionality you need to create this graph, therefore I've rewritten the example to just use SGPlot. And while I
Tag: Text Plot
The POSITION= option in the TEXT statement provides you with a way to position text in a variety of locations relative to a point. You can use this option to fine tune label placement in a plot primarily created by using the SCATTER statement and the DATALABEL= option.
Back in 2013, I wrote a paper for the SAS Global Forum, reviewing the attributes that go towards making a good graph. In this paper, I covered many recommendations from industry thought leaders that can help enhance the effectiveness of graphs to deliver the intended information. One of the aspects that
There has been some interest in "Circle Link Graph" diagrams where the nodes are laid out in a circle, with links going from one node in the circle to another. I recall seeing one diagram during the 2014 World Cup Soccer tournament, showing the number of players from one country that
A few weeks back I posted an article on ways to create a WindRose Graph using SGPLOT procedure. The process is relatively simple. Create (R, Theta) data with both numeric axes where the Theta is a value in the data range is 0-360, and R is the corresponding response value. Then
There are many situations where it is beneficial to display the data using a polar graph. Often your data may contain directional information. Or, the data may be cyclic in nature, with information over time by weeks, or years. The simple solution is to display the directional or time data
Over the Christmas Holidays I saw an graph of agricultural exports to Russia in 2013. The part that caught my eye was the upper part of the graph, showing the breakdown of the trade with Russia as a horizontal stacked bar with custom labels. The value for each region / country