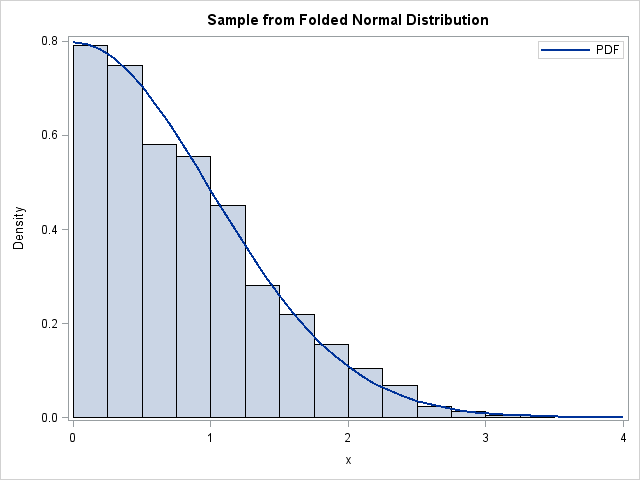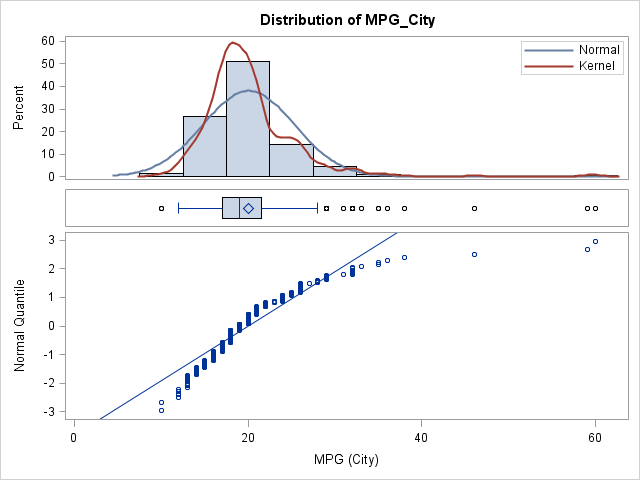
A three-panel visualization of a distribution

At a recent conference, I talked with a SAS customer who told me that he was using an R package to create a three-panel visualization of a distribution. Unfortunately, he couldn't remember the name of the package, and he has not returned my e-mails, so the purpose of today's article