Use the EFFECTPLOT statement to visualize regression models in SAS

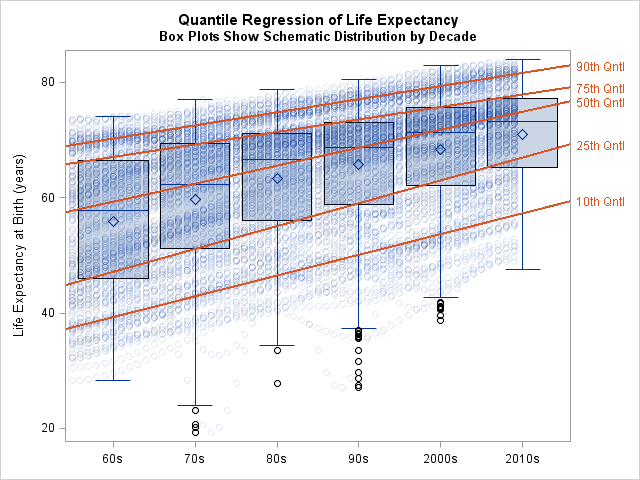
Graphs enable you to visualize how the predicted values for a regression model depend on the model effects. You can gain an intuitive understanding of a model by using the EFFECTPLOT statement in SAS to create graphs like the one shown at the top of this article. Many SAS regression