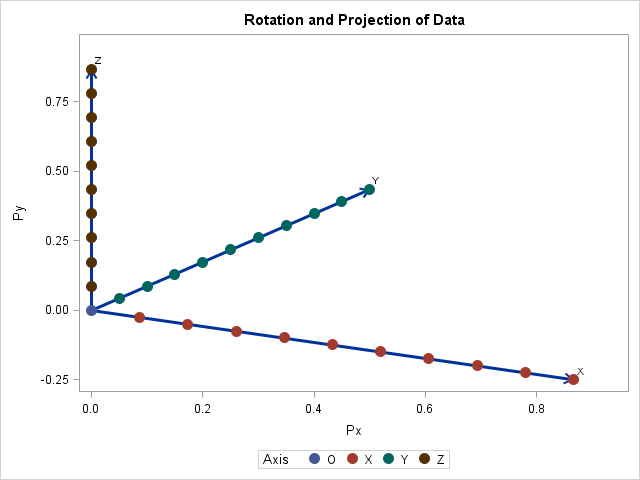
Tag: Statistical Graphics

Rick Wicklin 0
Overlay a curve on a bar chart in SAS

One of the strengths of the SGPLOT procedure in SAS is the ease with which you can overlay multiple plots on the same graph. For example, you can easily combine the SCATTER and SERIES statements to add a curve to a scatter plot. However, if you try to overlay incompatible

Rick Wicklin 0
Graph a step function in SAS

Last week I wrote about how to compute sample quantiles and weighted quantiles in SAS. As part of that article, I needed to draw some step functions. Recall that a step function is a piecewise constant function that jumps by a certain amount at a finite number of points. Graph

Rick Wicklin 0
Weighted percentiles

Many univariate descriptive statistics are intuitive. However, weighted statistic are less intuitive. A weight variable changes the computation of a statistic by giving more weight to some observations than to others. This article shows how to compute and visualize weighted percentiles, also known as a weighted quantiles, as computed by

1 65 66 67 68 69 104