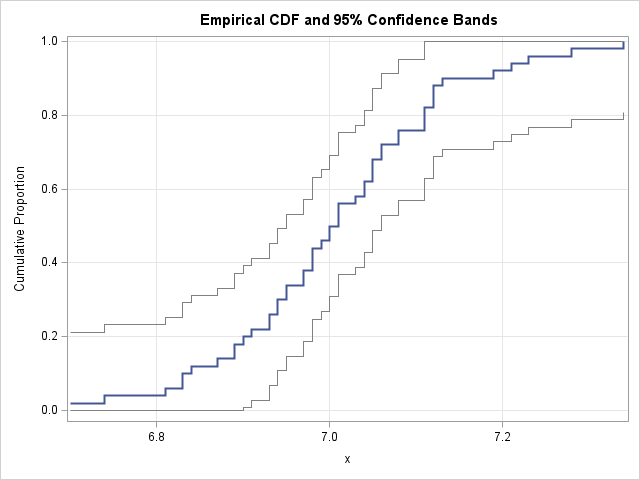
Tag: Statistical Graphics

Data Visualization
Dan Heath 0
Optimizing bar label placement

When creating bar charts, it is very common to display labels with the bars to make it easier to determine the bar values or to provide additional information in the chart. However, these labels can take away valuable data space, particularly if you generate a smaller-sized graph. As you see

Analytics | Learn SAS
Rick Wicklin 0
Estimate a bivariate CDF in SAS

This article shows how to estimate and visualize a two-dimensional cumulative distribution function (CDF) in SAS. SAS has built-in support for this computation. Although the bivariate CDF is not used as much as the univariate CDF, the bivariate version is still a useful tool in understanding the probable values of

1 2 3 4 10