Jittering to prevent overplotting in statistical graphics

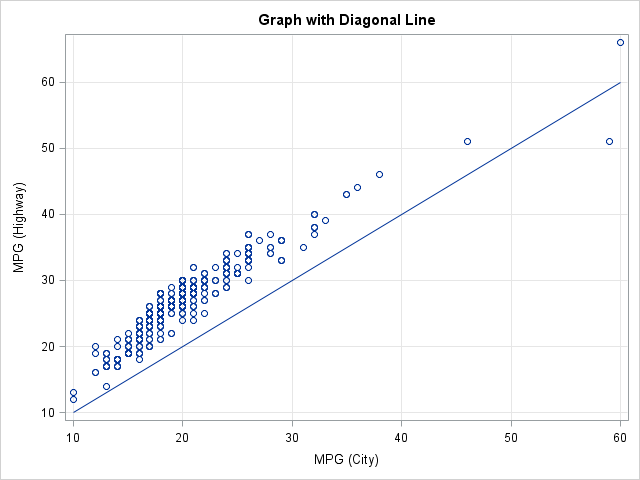
Jittering. To a statistician, it is more than what happens when you drink too much coffee. Jittering is the act of adding random noise to data in order to prevent overplotting in statistical graphs. Overplotting can occur when a continuous measurement is rounded to some convenient unit. This has the