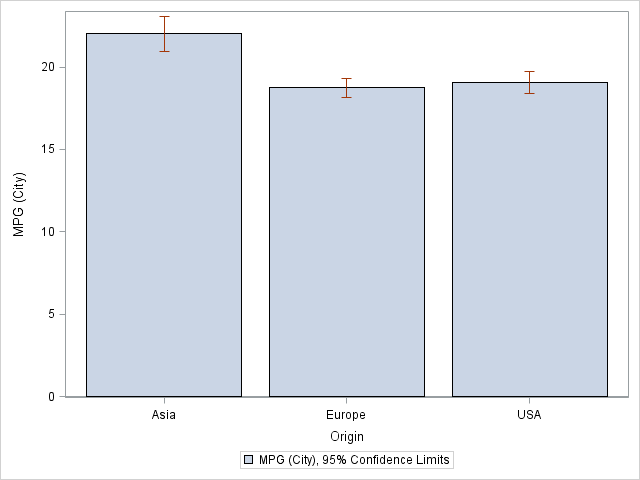
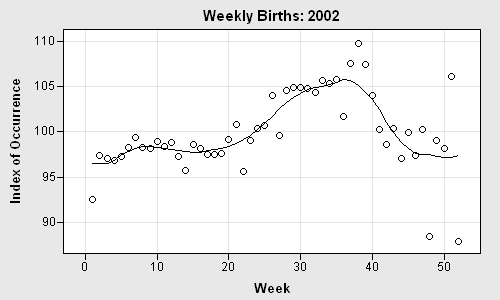
Tag: Statistical Graphics

Rick Wicklin 0
Visualizing Scrabble games

My elderly mother enjoys playing Scrabble®. The only problem is that my father and most of my siblings won't play with her because she beats them all the time! Consequently, my mother is always excited when I visit because I'll play a few Scrabble games with her. During a recent

Rick Wicklin 0
Visualizing correlations between variables in SAS

Exploring correlation between variables is an important part of exploratory data analysis. Before you start to model data, it is a good idea to visualize how variables related to one another. Zach Mayer, on his Modern Toolmaking blog, posted code that shows how to display and visualize correlations in R.

Rick Wicklin 0
Side-by-side bar plots in SAS 9.3

When I was at the Joint Statistical Meetings (JSM) last week, a SAS customer asked me whether it was possible to use the SGPLOT procedure to produce side-by-side bar charts. The answer is "yes" in SAS 9.3, thanks to the new GROUPDISPLAY= option on the VBAR and HBAR statements. For

1 97 98 99 100 101 104