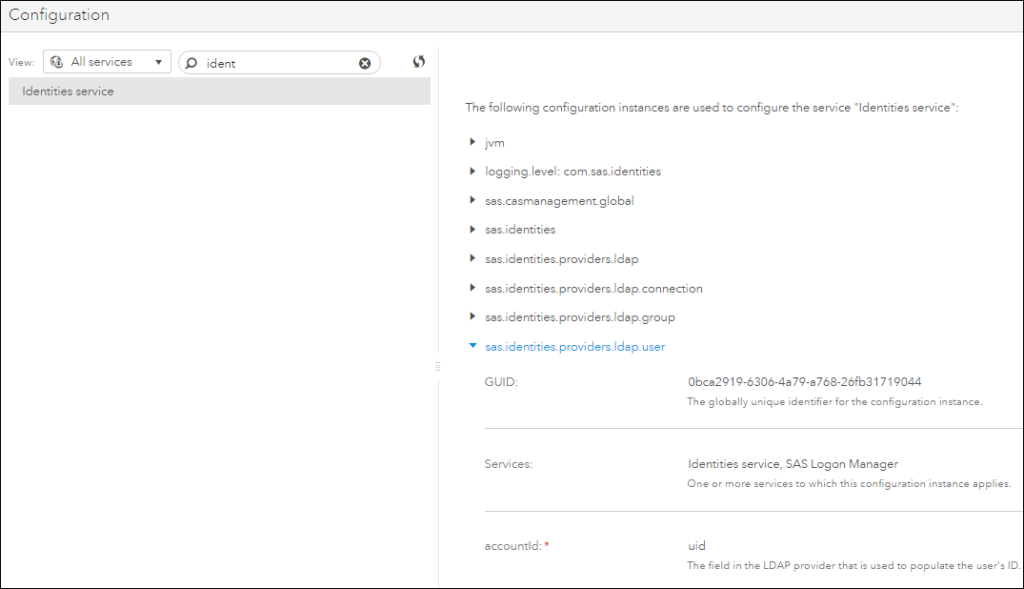
We have seen in a previous post of this series how to configure SAS Studio to better manage user preferences in SAS Grid environments. There are additional settings that an administrator can leverage to properly configure a multi-user environment; as you may imagine, these options deserve special considerations when SAS Studio
Tag: SAS Professional Services
The report-ready SAS Environment Manager Data Mart has been an invaluable addition to SAS 9.4 for SAS administrators. The data mart tables are created and maintained by the SAS Environment Manager Service Architecture Framework and provide a source of data for out-of-the box reports as well as custom reports that any
In a previous blog about SAS Studio I’ve briefly introduced the concept of using the Webwork library instead of the default Work. I also suggested, in SAS Global Forum 2016 paper, Deep Dive with SAS Studio into SAS Grid Manager 9.4, to save intermediate results in the Webwork library, because
Data virtualization is an agile way to provide virtual views of data from multiple sources without moving the data. Think of data virtualization as an another arrow in your quiver in terms of how you approach combining data from different sources to augment your existing Extract, Transform and Load ETL batch
If your SAS Visual Analytics report requirements include linking out to separate reports without the need to pass values, you may want to consider using images to enhance the appearance of your base report. Here are three style examples using images that you can use depending on your report design
Requirements that are the most easily described can often be the most difficult to implement. I’m referring to requests like: Display a gauge with the most recently collected metric. Plot a 18 month rolling window of profit. Display last month’s products percent of total metrics for visual comparison. Okay, so
In a previous blog post, I demonstrated combining the power of SAS Event Stream Processing (ESP) and the SAS Quality Knowledge Base (QKB), a key component of our SAS Data Quality offerings. In this post, I will expand on the topic and show how you can work with data from
One very useful type of auditing for a SAS administrator is to have summary data about the availability and performance of various resources (platforms, servers, services) from the 30,000-foot view. $1000 loan guaranteed. Using SAS Environment Manager, it's easy to go in and look at the availability of any one resource over
In a number of my previous blogs I have discussed auditing within a SAS environment and how to identity who has accessed data or changed reports. For many companies keeping an audit trail is very important. If you’re an administrator in your environment and auditing is important at your organization,
In a previous blog post I explained how end users should code and use shared locations for SAS artifacts, to avoid issues in a SAS Grid Manager environment. Still, they could still fall in some sharing issues, which could have very obscure manifestations. For example, users opening SAS studio might notice
The SAS Quality Knowledge Base (QKB) is a collection of files which store data and logic that define data cleansing operations such as parsing, standardization, and generating match codes to facilitate fuzzy matching. Various SAS software products reference the QKB when performing data quality operations on your data. One of
Analysts often use a simple moving average to get an idea of the trends in data. This is simply an average of a subset of time periods, and the size of the subset can differ depending on the application. The technique can be used with data based on time periods,
For many people, building something from scratch, no matter how simple or complex, is fascinating. That’s why programs similar to How’s It Made are so appealing and, for me, addicting. And thus, the inspiration for this blog; I will walk you through building a set of graphs and how to
Update-in-place supports the ability to update a SAS Deployment within a major SAS release. Updates often provide new versions of SAS products. However, when using the SAS Deployment Wizard to perform an update-in-place you cannot selectively update a machine or product. As a general rule if you want to update
After posting a couple of blogs on the subject of dates and date formats in Visual Analytics Designer, I got a question from a user who wondered how to compare data for a selected date to data from the same day of the previous year. Here’s one way to do
Reference lines on a visualization are used to help identify goals or targets, acceptable or unacceptable ranges, etc; basically any metric that puts a frame of reference around the values on the visualization. The Percent of Total of a metric is used to help identify a part-to-whole relationship. It answers
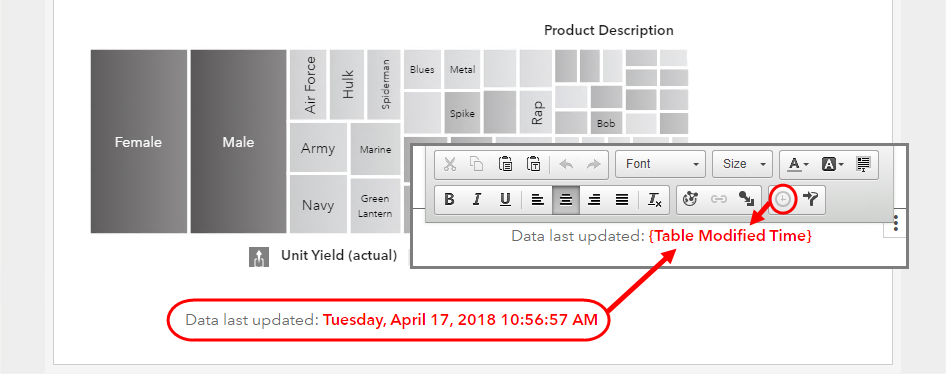
As a SAS administrator, you may face situations where you need to locate content that has been modified in the system since a given point in time. If the system has many content developers, discovering all of the folders, libraries, tables, reports, explorations, and similar items that have been modified can be
One of the jobs of SAS Administrators is keeping the SAS license current. In the past, all you needed to do was update the license for Foundation SAS and you were done. This task can be performed by selecting the Renew SAS Software option in the SAS Deployment Manager. More recently,
SAS Business Data Network is SAS’ solution for managing glossaries of common business terms. This is part of the SAS Data Governance offering as well as bundled with Advanced versions of all SAS Data Management bundles. One thing that is important regarding Data Governance in general, and this solution in
In DataFlux Data Management Studio, the predominate component of the SAS Data Quality bundle, the data quality nodes in a data job use definitions from something called the SAS Quality Knowledge Base (QKB). The QKB supports over 25 languages and provides a set of pre-built rules, definitions and reference data
The Distributed SAS 9.4 LASR Analytic Server provides a massively parallel processing solution for working very quickly with huge volumes of data. LASR was built from its earliest invocations to provide for incredible scalability and growth. One of the primary criteria which drives the considerations of scalability is load management.
Report designers often discover after aggregating data by groups in the Visual Analytics Designer that it would also be nice to see additional aggregations of the data, for example, a maximum or minimum of that sum across groups. This means creating an ‘aggregation of an aggregation.’ If you plan your report objectives in
As an addendum to my previous two blogs on using the SAS Environment Manager Report Center, this blog illustrates further tips and tricks you can use to help make the creation of your custom reports easier. The Ad-Hoc Reporting section of the Report Center is specifically designed to provide a
In DataFlux Data Management Studio, the data quality nodes (e.g., Parsing, Standardization, and Match Codes) in a data job use definitions from the SAS Quality Knowledge Base (QKB). These definitions are based on a locale (Language and Country combination). Sometimes you would like to work with multi-locale data within the
Nowadays, nearly every organization analyzes data to some degree, and most are working with “Big Data.” At SAS Global Forum 2016 in Las Vegas, a vast number of papers were presented to share new and interesting ways our customers are using data to IMAGINE. CREATE. INNOVATE., as this year’s conference tagline
Pick your category? If this title seems familiar, that’s because in my last blog, Use parameters to pick your metric in VA Reports, I covered how to use parameters to allow your users to pick which metric they want to view in their visualizations. This is a great technique that
Being a SAS consultant is about solving problems. In our day-to-day work we solve myriads of all sorts of problems – technical problems, data problems, programming problems, optimization problems – you name it. And in the grand scheme of things we solve business problems. But without a well-defined business
My previous blog discussed the SAS Environment Manager Report Center, and talked about its organization, and how to start using some of the prompts to get the reports you want. The next step is to learn to use some of the example reports provided to help you design your own, production-level
Trusted data is key to driving accurate reporting and analysis, and ultimately, making the right decision. SAS Data Quality and SAS Data Management are two offerings that help create a trusted, blended view of your data. Both contain DataFlux Data Management Studio, a key component in profiling, enriching monitoring, governing
New default parameter values for Platform Suite for SAS Sometimes, when your kids grow older, they change their habits and you don’t recognize their behaviors any more. “We play this game every year at the beach. Don’t you like it anymore?” you ask. “Dad, I’m not seven years old any