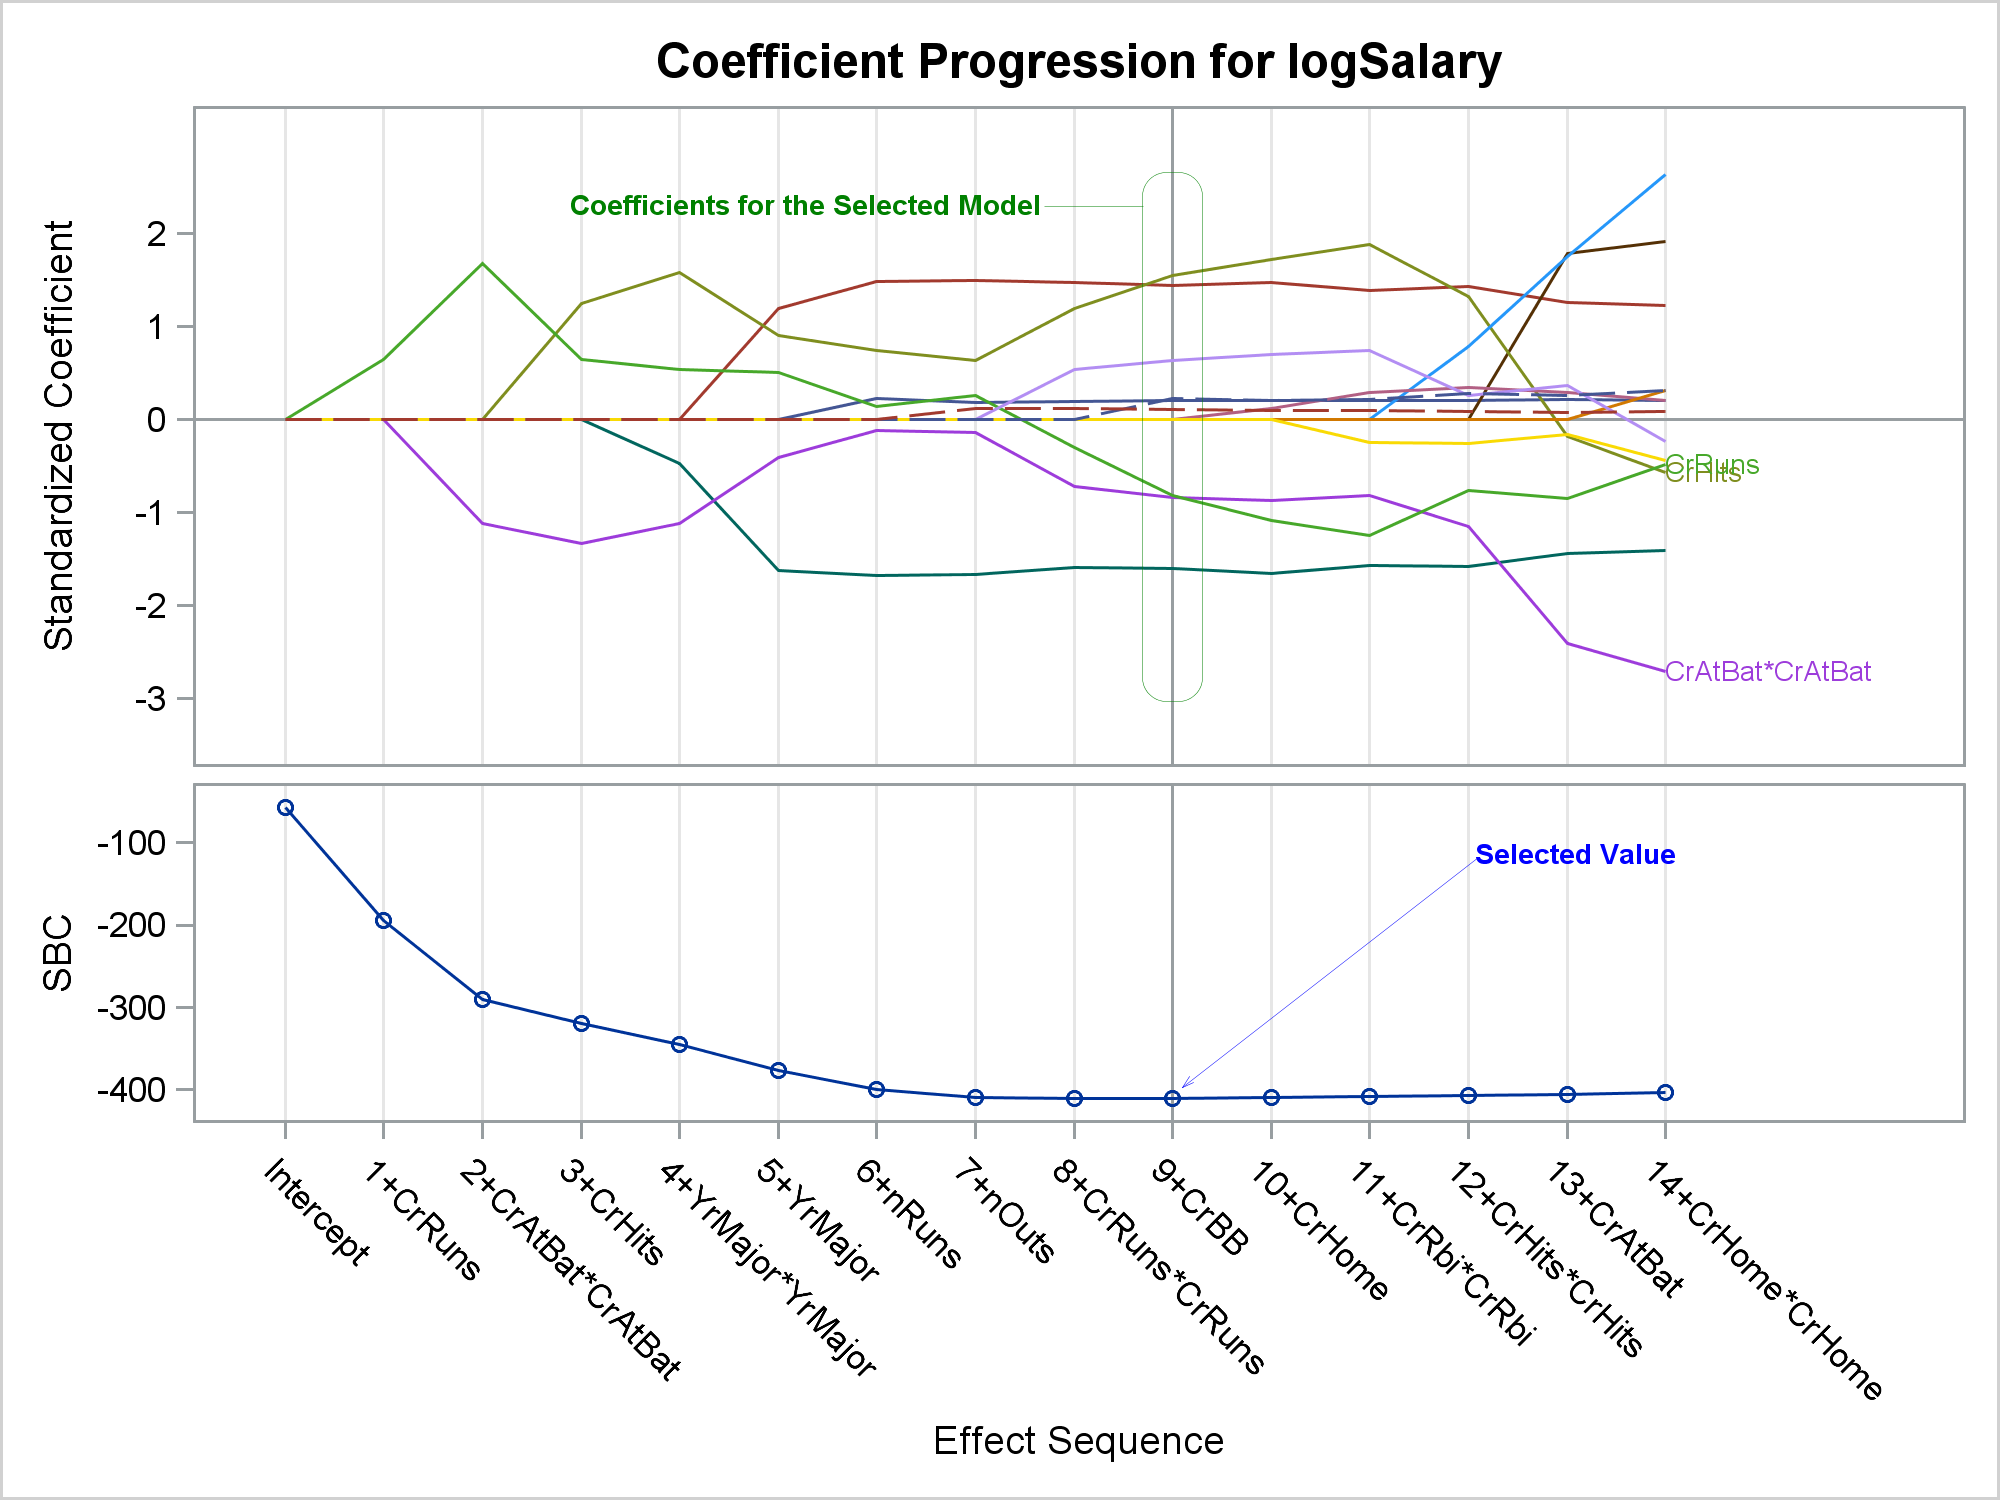
In the past few weeks, I have written two posts on SG annotation and on saving and then modifying the graphs that analytical procedures produce: Modifying dynamic variables in ODS Graphics Annotating graphs from analytical PROCs Today, I finish this series with one more post. This one shows how you
Tag: Layout Overlay
In reference to a previous article on Violin Plots, a reader asked about creating comparative mirrored histograms to compare propensity scores. While I had my own understanding of "Mirrored Histograms", I also looked this up on the web. Google showed many cases of two histograms back to back, either horizontally or vertically.
I am happy to report that my new book "Getting Started with the Graph Template Language in SAS" is now shipping. A colleague suggest it would be useful to post some articles with the same theme of "Getting started". I thought that was a great idea, and decided to start a new
Often we want to display data as a bar chart where a few observations have large values compared to the rest. Comparison between the smaller values becomes hard as the small bars are squeezed by the tall bars. Here is an example data, and a bar chart showing the data. The large values
This post is a result of an intriguing question posed by a user on the SAS communities' page. How to create a bar chart where the category is a combination of two variables var_1 and var_2 (each with values of '+' and '-'), and get a X axis that shows each
Here are a couple of bar charts showing the city mileage of cars by Type and Origin using the SGPLOT procedure from the sashelp.cars dataset. title 'Vehicle Mileage by Type'; proc sgplot data=cars; format mpg_city 4.1; vbar type / response=mpg_city stat=mean datalabel; xaxis display=(nolabel); run; title 'Counts by Country'; proc sgplot