클라우드 기반 AI 분석 플랫폼인 SAS Viya 4에는 여러 가지 유용한 기능이 있습니다. 이번 글에서는 SAS Viya 4를 위한 Logging & Monitoring 기능에 대해 소개 드리겠습니다. 1. Logging & Monitoring 이란 무엇인가? Logging과 Monitoring은 해석 그대로, 해당 서비스에 대한 로그 기록과 상태를 시각적으로 표시해주는 것을 의미합니다. 기존 SAS Viya
Tag: graph
Do you need to see how long patients have been treated for? Would you like to know if a patient’s dose has changed, or if the patient experienced any dose interruptions? If so, you can use a Napoleon plot, also known as a swimmer plot, in conjunction with your exposure
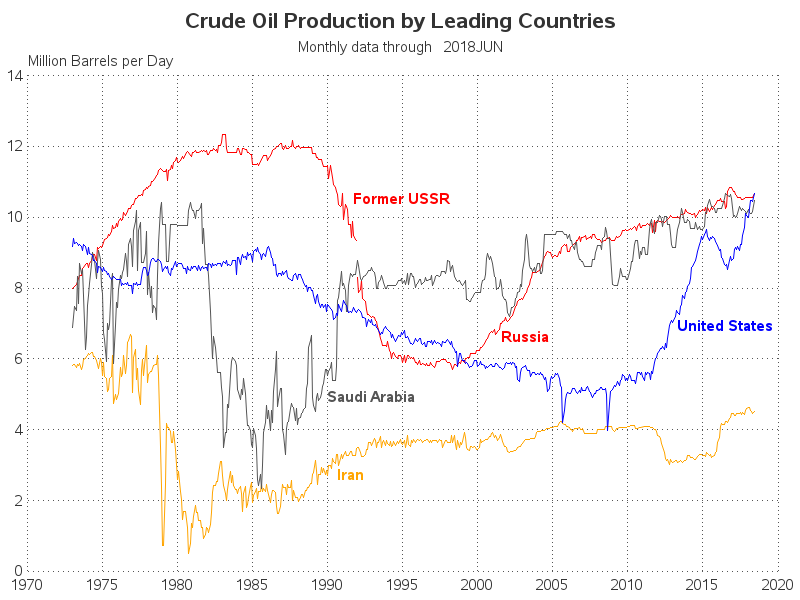
Over the years, the US has drilled for crude oil in several locations, such as Pennsylvania, Texas, Alaska, and the Gulf of Mexico. A few years ago, as the US started drilling more in North Dakota, there were forecasts that we would surpass Saudi Arabia in crude oil production. And recently,
Elections are in the news again, therefore I have been on the lookout for interesting graphs. I recently found some graphs of the Census Current Population Survey (CPS) Voting and Registration Supplement data, and tried to improve them. Follow along if you're interested in voter data, or creating better graphs!
When you were a kid, were you intrigued by the 99-cent X-ray glasses advertised in the back of the comic books? If you ordered those glasses, you were probably disappointed. Now that you're an adult, how would you like to use computer techniques to "X-ray" your data and look for
If you consider yourself as a visualization expert, you strive to create graphs that set you apart from the data analysts and statisticians. Graphs that merely plot the data in a clear/concise manner aren't enough for you. You want your graphs to also be intuitive, easy to read, and provide
Are you the lone-wolf SAS programmer in your company - managing the data, performing the analyses, and graphing the output for everyone else? And what's the only format they all know how to work with, and wish they had your output in? Let's face it ... that's probably an Excel
For the first time in 4.5 years, we had a day with zero sunspots - I think this special occasion calls for some sunspot graphs! But before we get started, here's one of the many pictures my friend Kirk took of the sun down in Marco Island, Florida. Spots or no
There's a lot of buzz about Hadoop these days. I started checking into it, and there seemed to be a gazillion releases. So, being The Graph Guy, I decided to create a graph to make it a little easier to digest! During my search for Hadoop information, I found the
What is it that people like so much about motorcycles? The thrill/excitement/freedom of riding them, the 'biker image' portrayed in movies, or great songs such as Little Honda by the Hondells? I'm not a biker per say, but I do have a couple of motorcycles, and am a known associate
Greece has been in the news lately, trying to secure funds to repay 1.5 billion euros to the International Monetary Fund (IMF) by the end of the month. And as luck would have it, there is some data available and some graphs to be created ... I love this job!
Nobody puts an arrow through a heart any better than Sam Cooke & Cupid ... but SAS/Graph comes close! If you've been following my blog, you know that my favorite of all the SAS Procedures are the traditional SAS/Graph Procs, such as GPlot and GMap. They're rock-solid reliable, and flexible
If you're a SAS user, chances are you're a bit of a science/technology/engineering/math nerd -- and also a fan of The Big Bang Theory. Therefore this SAS analysis on The Big Bang Theory should be right up your alley! Yesterday (September 22) was the start of the 8th season for the TV series,
It's easy to plot events that happened at a certain time, but what about events that extended over a range of dates, such as recessions? ... This blog post teaches you a nice trick to use for that! Let's say you have a plot of the labor force participation rate
The sun has gone eerily quiet, in the middle of what should be the height of the 11-year sunspot cycle... Here's a superb photo of some sunspots that Stephen A. Carr posted to the Telescope Addicts Facebook group - a group which I follow with great interest. (Thanks for allowing
SAS is great at helping make important business decisions - how about helping decide where to take your next vacation?... Here's a picture from one of my favorite vacations with my buddy Joe. As you can see, I like "nature vacations." Can you guess where this one was? (leave a comment with
All my friends seem to be having twins these days (below is a picture of my friend Holly's twins, for example) - I wondered if I could use SAS to analyze this twinning trend ... When I was growing up, way back in the day, twins seemed to be rarity.
Have you heard the expression "Talk Turkey"? Well then, what better (tongue-in-cheek) thing to do around the Thanksgiving holiday, than talk some turkey using SAS Graphs! ;) I don't usually decorate my graphs with images and pictures (they typically make the graph more difficult to read), but when it comes
When working with "big data" you usually have too many points to view in a plot, and end up subsetting or summarizing the data. But now, in SAS 9.3, you have an alternative! For example, the following scatter plot of 10,000+ points is just a visual "blob": But using a new