This article was co-authored by Colby Hoke.
In a previous article, I wrote about a mistake I made as a student in analytics. In short, my team handed off our training code and training data as the deliverable for our Capstone project, citing that the users can rerun our training code to get the model. I’m glad to report that I have seen the error of my ways. As my penance, I hope to steer other data scientists away from this path and towards being more productive and more appreciated members of their analytical teams. So, let’s talk about training code, scoring code, and what makes a model.

What is a model?
A machine learning model is an object that quantifies a pattern within a dataset and is meant to approximate a real-world relationship. By building a machine learning model on what’s already happened, we hope to predict what may happen in the future. By understanding the future, we can make better decisions now. In this article, we’re going to focus, specifically, on supervised machine learning, which is the branch of machine learning concerned with predicting labeled outcomes.
For example, a group of students may want to know how long they need to study to make an A on their final exam. They may look at various measures from students in previous terms, like grades on previous exams as well as time spent studying or time spent goofing off. These students may train a regression model and come up with an equation like so:
Final-Exam-Grade = 0.7*Midterm-Grade + 4*Hours-Studying– 2*Hours-Scrolling-Phone
Or they may train a decision tree model and come up with a series of rules like:
If Midterm-Grade >= 80 and if Hours-Studying >= 4: Final-Exam-Grade is A
Else if Midterm-Grade >= 80 and if Hours-Studying < 4: Final-Exam-Grade is B
Else if Midterm-Grade < 80 and if Hours-Studying >= 6: Final-Exam-Grade is B
Else: Final-Exam-Grade is C
Decision trees and regressions are both common types of models. But how did the students know to weigh the Midterm-Grade as 0.7 in the regression? Why not 0.8? Or 0.75? And how did they come up with 4 as the magic number for getting an A in the decision tree model when determining how long they need to study if their midterm grade is greater than 80? Well, that’s where model training comes in.
What is training code?
Training code uses labeled data to build the model. This code uses a lot of mathematical calculations to find and quantify patterns between the input variables and the labeled outcome of interest. Computers are well suited for these kinds of problem as they can make these calculations far faster than you or I.
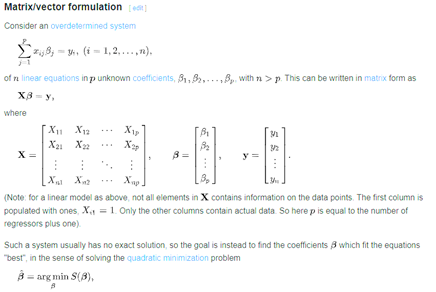
The method for building the model varies based on the type of machine learning model being built. For example, our students might have used their knowledge of matrix multiplication to write a program to calculate the Ordinary Least Squares (OLS) to determine that the values of 0.7, 4, and 2 minimized the differences between their regression model’s prediction and the labels in their data…just kidding. If they could break out matrix multiplication, they probably don’t need to worry about their exam.

Luckily for us, a lot of this complexity has been abstracted away. When we go to train the model, we often just need to decide which type of model we want to train and the parameters we’d like to try. And with capabilities like hyperparameter autotuning and automated machine learning, training a model becomes much easier on us. (But maybe not for the computer, which is still running all those calculations.)
Training the model may also include steps to prepare and clean the data so that it’s in the form the model expects. It may involve experimentation, where a data scientist assesses the model on metrics like accuracy or fairness, makes a change, retrains a model, and sees if there is an improvement.
Training the model is the hard part. It takes computational time, data science skill sets, an understanding of the use case, and labeled data. But, once we know have our model, it’s easy and fast to score new data.
What is scoring code?
Scoring code takes unlabeled data, sends it through the trained model, and returns the model’s prediction. The scoring code may also include steps to prepare and clean raw data so that it matches the form the model expects before letting the model score the data.
For complex models, modeling logic may not be stored in a human-readable equation or series of rules but, rather, a machine-readable file. Common file type that may represent models include Pickle for Python models; Analytical store (ASTORE) for SAS models; and rdata, rds, or rda for R models. When the model is saved as an object it must be loaded before it can be used to score data.
And, finally, scoring code may also include additional post-processing on the results of the model so that the information returned matches the expectations of the user or system.
Scoring code often takes the form of a function—where the input variables or raw data are the inputs to the score code—and the model’s prediction, or processed results, are returned. For example, the students may have scoring code like the following for the regression model:
Predict_A_Grade (Midterm-Grade, Hours-Studying, Minutes-Scrolling-Phone):

                # Preprocess and Clean<
                If Minutes-Scrolling-Phone is NULL:
                                Minutes-Scrolling-Phone = 0
                Hours-Scrolling-Phone = Minutes-Scrolling-Phone / 60

                # Score data using model
                Final-Exam-Grade = 0.7*Midterm-Grade + 4*Hours-Studying– 2*Hours-Scrolling-Phone

                # Post-process results
                If Final-Exam-Grade >= 90;
                                Grade = “A”
                Else:
                                Grade = “Not A”

                # Return outputs
                Return Final-Exam-Grade, Grade
Reimaging the handoff between Data Science & Engineering
Let’s change when the handoff occurs. Instead of a data scientist’s role being done once a model object is available, handoffs should take place once the model is in a form that can be used outside of the training code to score new data. Creating scoring code makes the hand-off between data science and engineering—between model training and model deployment—much easier.
For users of SAS Model Manager on SAS Viya, the good news is that there are capabilities to make this process far easier. Score code is automatically written for SAS models registered from SAS Model Studio or SAS Visual Analytics. This means that score code is generated for these models with the click of a button! Score code is also generated for models trained in SAS Studio and registered into SAS Model Manager using the import model macro or one of the steps. Not training models in SAS? No problem! Open-source packages like Python-sasctl and R-sasctl can help generate the score code as well.
Making better decisions using machine learning models is a team effort. Data scientists excel in their craft, and their contributions are invaluable. But it's time to take their impact to the next level. The future is moving towards a more integrated and efficient approach to machine learning and the era of "throwing your model over the fence" is over. By actively sharing essential modeling assets, such as score code, we can enhance collaboration with engineering teams. Through this closer relationship, we’ll deploy models faster, make more accurate decisions, and achieve better outcomes.
Learn More
READ MORE | Read more on ML from the same authorREAD MORE | Read more on model training in SAS Viya Workbench
READ MORE | See how supervised learning works with a real-world problem


