Note from Udo Sglavo: Coping with the impact of COVID-19 has many different facets. How can we bring workers back in a safe and socially responsible fashion? In this blog, Hardi Desai, Sr Associate Machine Learning Developer, introduces a solution for physical distance monitoring using computer vision in factories. The application combines real-time anonymized person detection and tracking with interactive dashboards providing summary statistics build using SAS' deep learning features of SAS Visual Data Mining Machine Learning, SAS Event Stream Processing, and SAS Visual Analytics capabilities.
A US-based manufacturer of indoor rowing equipment company, “WaterRower”, was concerned with how to manage the health and safety of their employees at work during the COVID-19 pandemic. Given the situation, Peter King, CEO of Water Rower, decided to collaborate with SAS to use SAS AI capabilities to help their workers safely return to the workplace. SAS, along with our technology partner SuperMicro, were able to successfully develop and deploy a computer vision physical distance monitoring solution for WaterRower.
Physical Distance Monitoring
Using the existing security camera video footage at WaterRower, we built a solution consisting of a real-time dashboard, an alerting mechanism, and a post-facto dashboard to monitor compliance with physical distancing and crowd density guidelines. All of this was accomplished in a non-disruptive and anonymized manner.*
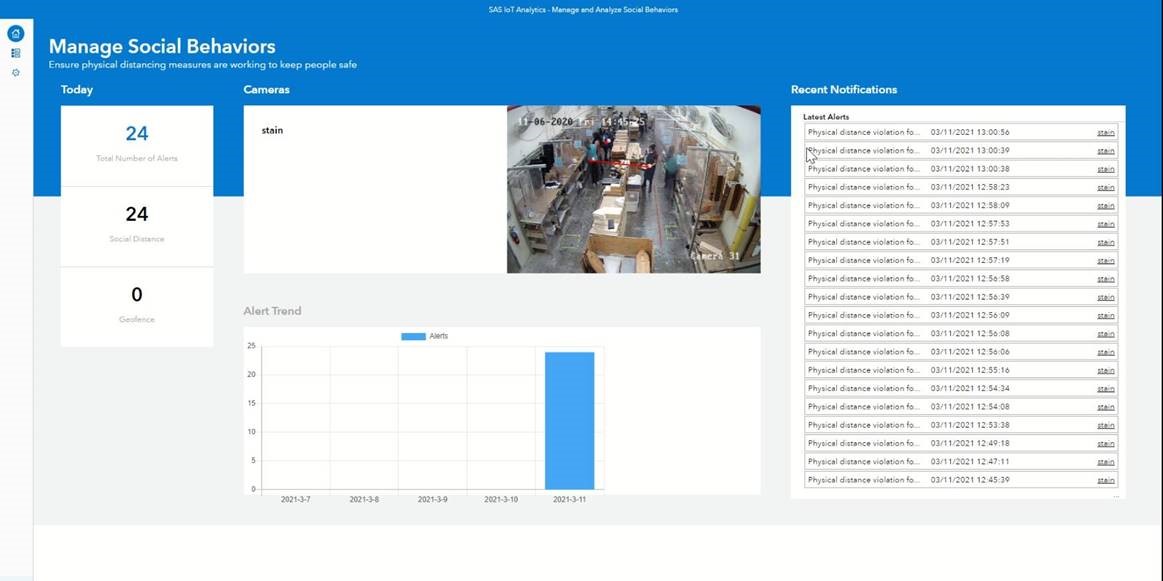
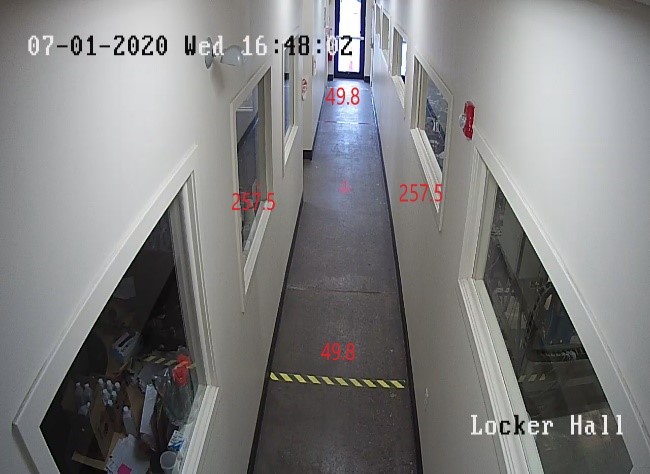
The real-time dashboard consisted of a front page displaying the activities of employees. It also included a summary of total violations and recent notifications. Please see Figure 1. Every person is denoted as a dot in the real-time camera feed on the dashboard. In the footage, we also drew a red line when the estimated distance between the individuals was less than the set threshold (here, 6 feet). The line is colored yellow in case the individuals are maintaining the distance closer to 6 feet.
* Please note to address the privacy concerns, our solution tracks individuals anonymously.
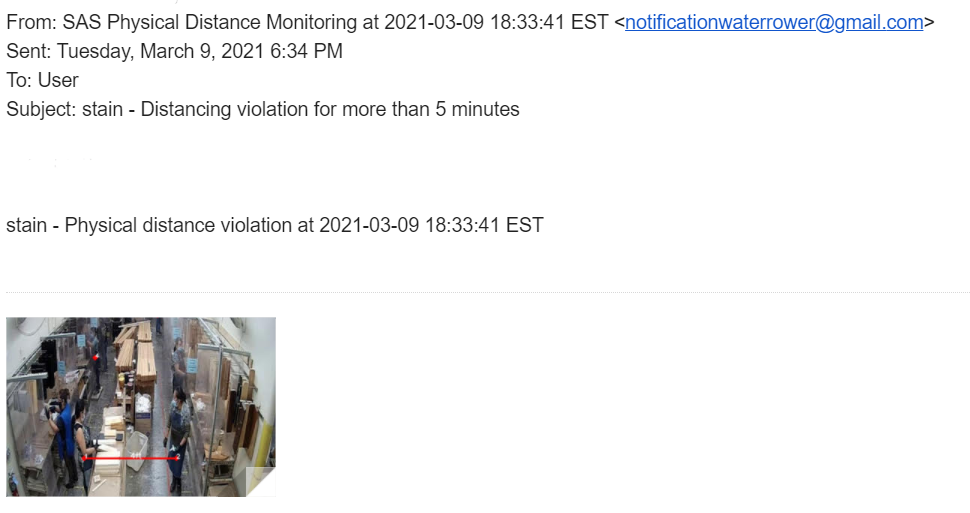
This is the email alert notification for violations sent to the designated person at Water Rower. The alert is based on the image captured in figure 2.
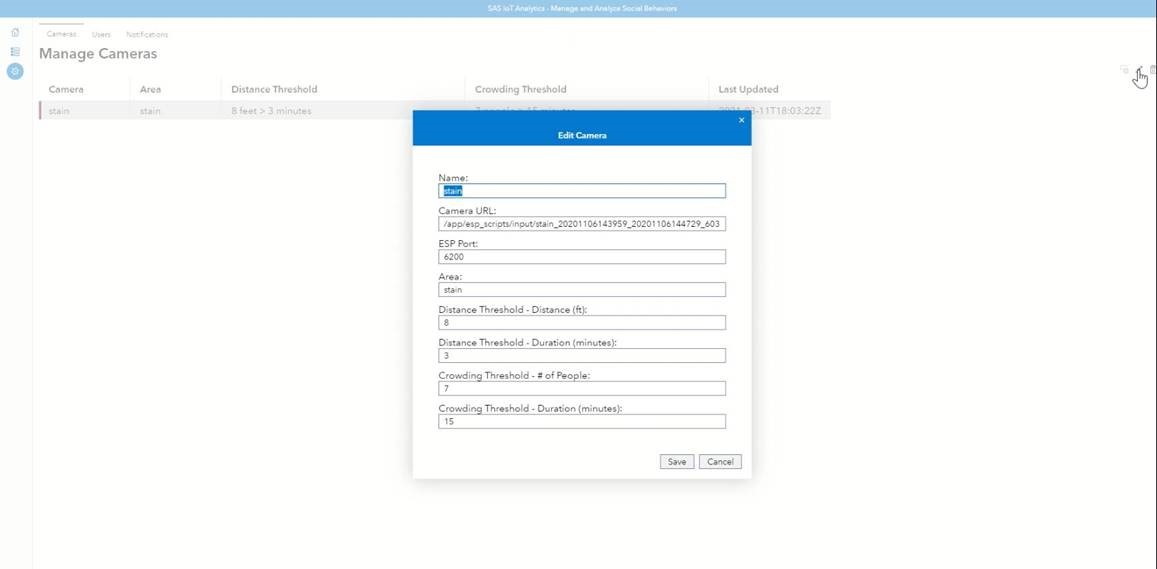
Given the fact that no two interactions were the same, the definition of which interactions were to be considered violations (based on the distance and time) was an open-ended question. So, we decided to provide the functionality to be able to set the distance and time threshold. This is depicted in Figure 3.
Analytics Life Cycle
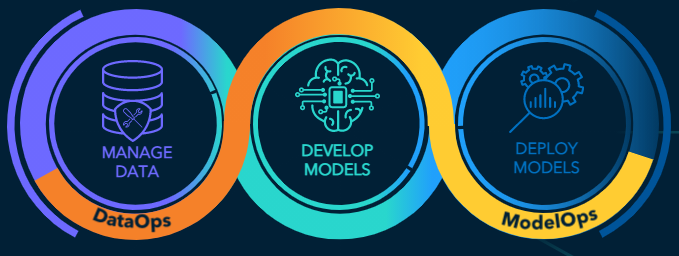
Now that you are aware of the use case and the solution built, let’s dive deeper and learn about different stages in an analytics life cycle pipeline (Figure 4). You will also learn how it was implemented in this use case.
Data Management
For any analytics project, one of the most crucial steps is data collection and its management. It serves as the base for the entire project. We utilized the existing security camera infrastructure at WaterRower to collect the video footage for training. To have diversity in our data, we collected it from multiple cameras. It was streamed at 15fps. We collected approximately 20k frames per camera footage. This ensured that we accounted for variations in lighting conditions and the crowd density during different times of the day.
We also observed differences in data as seasons changed during the course of this project. Various rooms which got direct sunlight for long periods of time in summer were getting much less during the winter months. This caused the images in winter to be darker compared to summer. Due to this, we collected additional data with darker images and the models were retrained using this data.
Model Development and Deployment
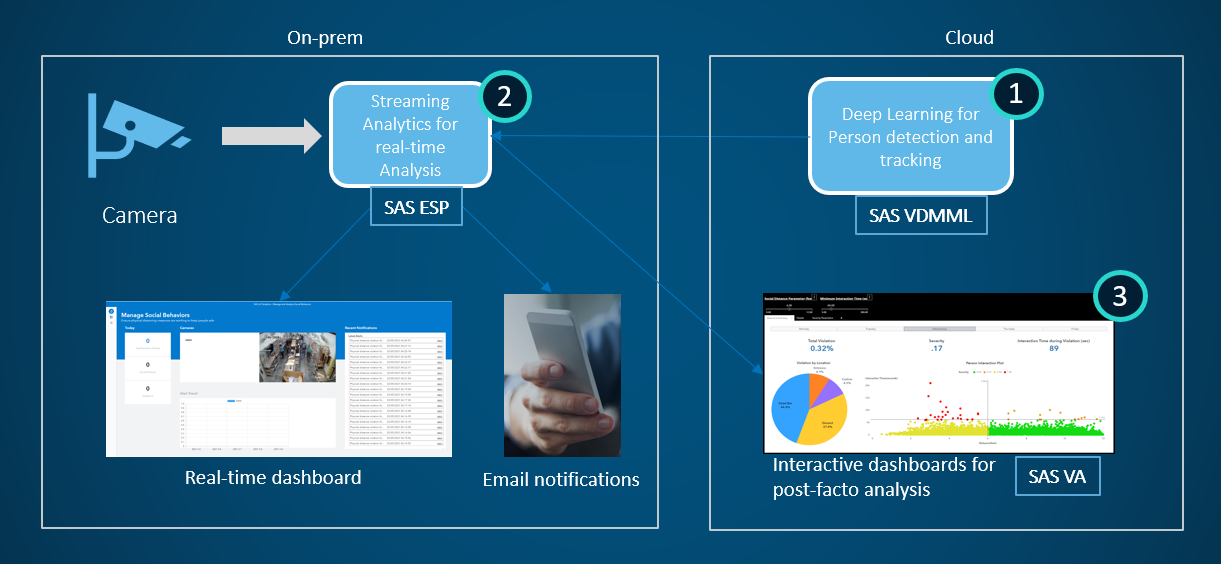
To gain a better understanding of the model development and deployment, let’s walk through the high-level architecture of this solution.
As depicted in Figure 5, we developed the deep learning based on the person detection model and tracking for Water Rower, using the data described above. We worked on training a lightweight architecture model as it would have a lesser number of parameters. This provided us good real-time performance and faster inference on the edge device.
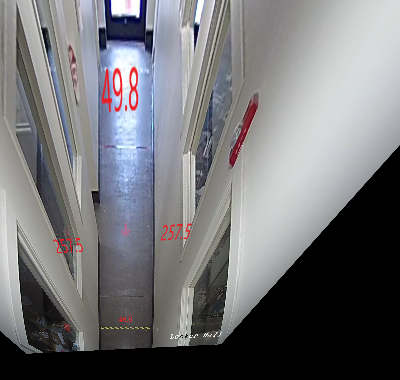
These trained models were then passed on to the GPU-accelerated edge device for inference. Real-time person tracking and calculation of the distances between individuals was performed on edge using SAS Event Stream Processing (ESP). In the tracking window in SAS ESP, the detected individuals were tracked using a randomly assigned number. This is done because our solution respects individual privacy. For the calculation of true world distances from an image, it is important to correct the camera angle. We corrected the camera angle using a perspective transform aligned with some reference markers in our physical space to get the top-down view. See Figures 6a and 6b.
The on-premises deployment of the edge device is put in production using a docker container which initiates the model inference, IoT dashboard, and email notification from SAS ESP. The notification is generated by historical interaction data between two individuals stored in running windows based upon the distance and time threshold set. Furthermore, we also have the capability to build visual analytics dashboards. They summarize the trends of the interactions as well violations by day of the week, location, and time of the week.
Conclusion
SAS’ capabilities of seamless integration of its model training, data management, and dashboarding aid in the development of advanced analytics projects. Aspects of this project could be expanded to multiple industries for different use-cases. The person detection and tracking could be used in the retail industry to understand customer behavior. The geofencing and real-time alert notification system can be applied in manufacturing settings for restricted zoning. As SAS continues to build innovative solutions, this list will continue to grow.
LEARN MORE | SAS ViyaThis is the eleventh post in our series about statistics and analytics bringing peace of mind during the pandemic.