Strengthen your programming skills with tips and techniques from the experts

Wouldn’t it be great if we could create a Python environment with only the packages and versions we need? Enter: virtual environments.
Strengthen your programming skills with tips and techniques from the experts

Wouldn’t it be great if we could create a Python environment with only the packages and versions we need? Enter: virtual environments.

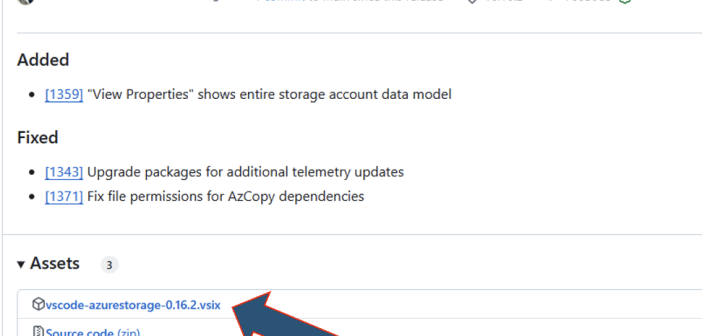
This article provides a step-by-step guide on manually installing VS Code extensions when access to the online marketplace is restricted, including downloading .vsix files from GitHub and handling dependencies.

SAS' Simon Topp walks you through how to setup SAS Container Runtime Testbench to make operating and debugging your SAS Intelligent Decisioning decisions a breeze

Fitting a Support Vector Machine (SVM) Model - Learn how to fit a support vector machine model and use your model to score new data In Part 6, Part 7, Part 9, Part 10, and Part 11 of this series, we fit a logistic regression, decision tree, random forest, gradient

Fitting a Neural Network Model - Learn how to fit a neural network model and use your model to score new data In Part 6, Part 7, Part 9, and Part 10 of this series, we fit a logistic regression, decision tree, random forest and gradient boosting model to the

SAS' Danny Sprukulis takes you step-by-step through geocoding incomplete geographic data sources for proper visualization and through its additional capabilities.

SAS' Danny Sprukulis walks through how he developed a model theme park to simulate attraction wait times for operational decision-making.

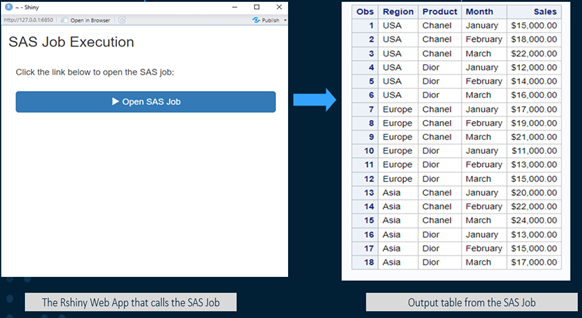
In the SAS 9.4 world, SAS Stored Processes (STP) were incredibly popular. An STP is a SAS program that is stored on a server and can be executed as required by requesting applications. On SAS 9.4, they were widely used for web reporting, analytics, building web applications, delivering packages to customers and publishing results to channels or repositories.

Fitting a Gradient Boosting Model - Learn how to fit a gradient boosting model and use your model to score new data In Part 6, Part 7, and Part 9 of this series, we fit a logistic regression, decision tree and random forest model to the Home Equity data we

SAS' Kirby Thomas demystifies joins, one of the more complicated data-merging tasks for new coders.