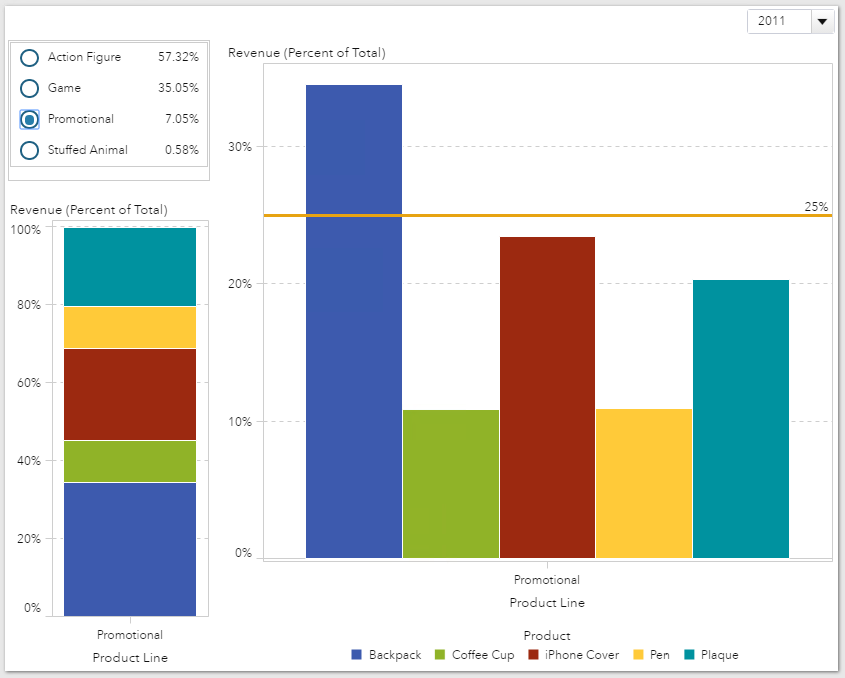
Pick your category? If this title seems familiar, that’s because in my last blog, Use parameters to pick your metric in VA Reports, I covered how to use parameters to allow your users to pick which metric they want to view in their visualizations. This is a great technique that
Tech
Being a SAS consultant is about solving problems. In our day-to-day work we solve myriads of all sorts of problems – technical problems, data problems, programming problems, optimization problems – you name it. And in the grand scheme of things we solve business problems. But without a well-defined business
PROC FREQ is often the first choice when you want to generate basic frequency counts, but it is the last choice when it is compared to other statistical reporting procedures. People sometimes consider PROC FREQ last because they think they have little or no control over the appearance of the
My previous blog discussed the SAS Environment Manager Report Center, and talked about its organization, and how to start using some of the prompts to get the reports you want. The next step is to learn to use some of the example reports provided to help you design your own, production-level
SAS Global Forum 2016 recently concluded and by all measures it was a huge success. With more than 5,000 attendees, hundreds of crazy-good talks and countless networking and learning opportunities, it very likely was the best SAS users’ conference yet. To put a bow on this year’s event, and help
Trusted data is key to driving accurate reporting and analysis, and ultimately, making the right decision. SAS Data Quality and SAS Data Management are two offerings that help create a trusted, blended view of your data. Both contain DataFlux Data Management Studio, a key component in profiling, enriching monitoring, governing
I’ve been giving presentations about SAS® ViyaTM for a couple of months now, and the reactions have been positive. I’m part of a much bigger cast of speakers at SAS who talk about the new analytics platform with key customers and analysts. While some presenters focus on the overarching benefits or the
New default parameter values for Platform Suite for SAS Sometimes, when your kids grow older, they change their habits and you don’t recognize their behaviors any more. “We play this game every year at the beach. Don’t you like it anymore?” you ask. “Dad, I’m not seven years old any
In a previous blog, I discussed SAS date and time values, and how date and time formats can be used to your advantage in SAS Visual Analytics. That blog addressed some of the features provided for handling date information, like date formats, date hierarchies, and calculated data items based on time
Look at the report below. Imagine being asked to allow your users to select which Measure, highlighted in yellow, they are looking at: Income, Expense or Profit. This is a frequent report requirement and I’m going to outline just one of the ways you can design your report to satisfy